Predicting InceptionV1 neuron 4e:55: appendix
Methods, exact prompts, data and every experiment behind the thread, in enough detail to reproduce. The essay being tested is “Neural networks are already clean”, which describes 4e:55 as a V-shape neuron: pointed things drive it, round ones push it negative. The game is here. The thread's first image is explained in §3.
1. The task: what “fires” means
- Model. InceptionV1 (GoogLeNet), the original TensorFlow/Lucid release, loaded with
lucent.modelzoo.inceptionv1(pretrained=True). Input convention: RGB pixels in 0–255 minus 117. - Images. ImageNet-1k from the Hugging Face dataset
ILSVRC/imagenet-1k, all 50,000 validation and 1,281,167 training photos. Each photo is resized (bicubic) so its short side is 224 px, center-cropped to 224×224 and stored as JPEG quality 90. That crop is what the model sees and what the game shows. - The neuron's value on a photo. Channel 55 of layer
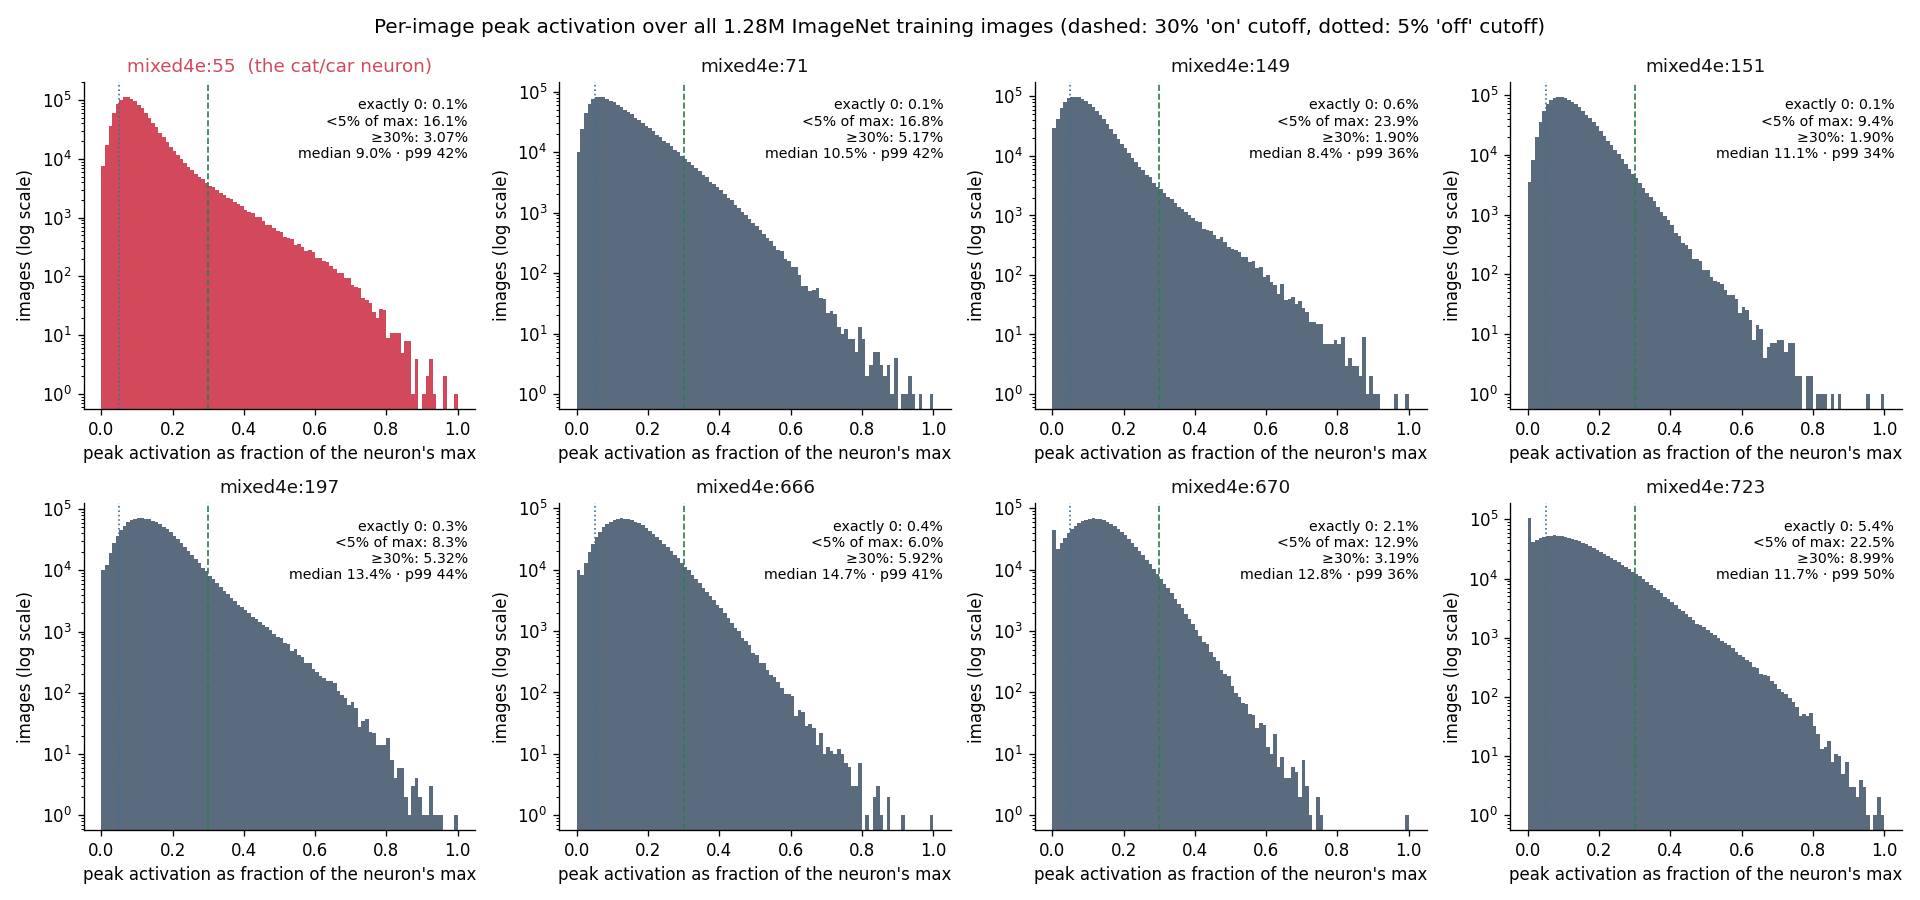
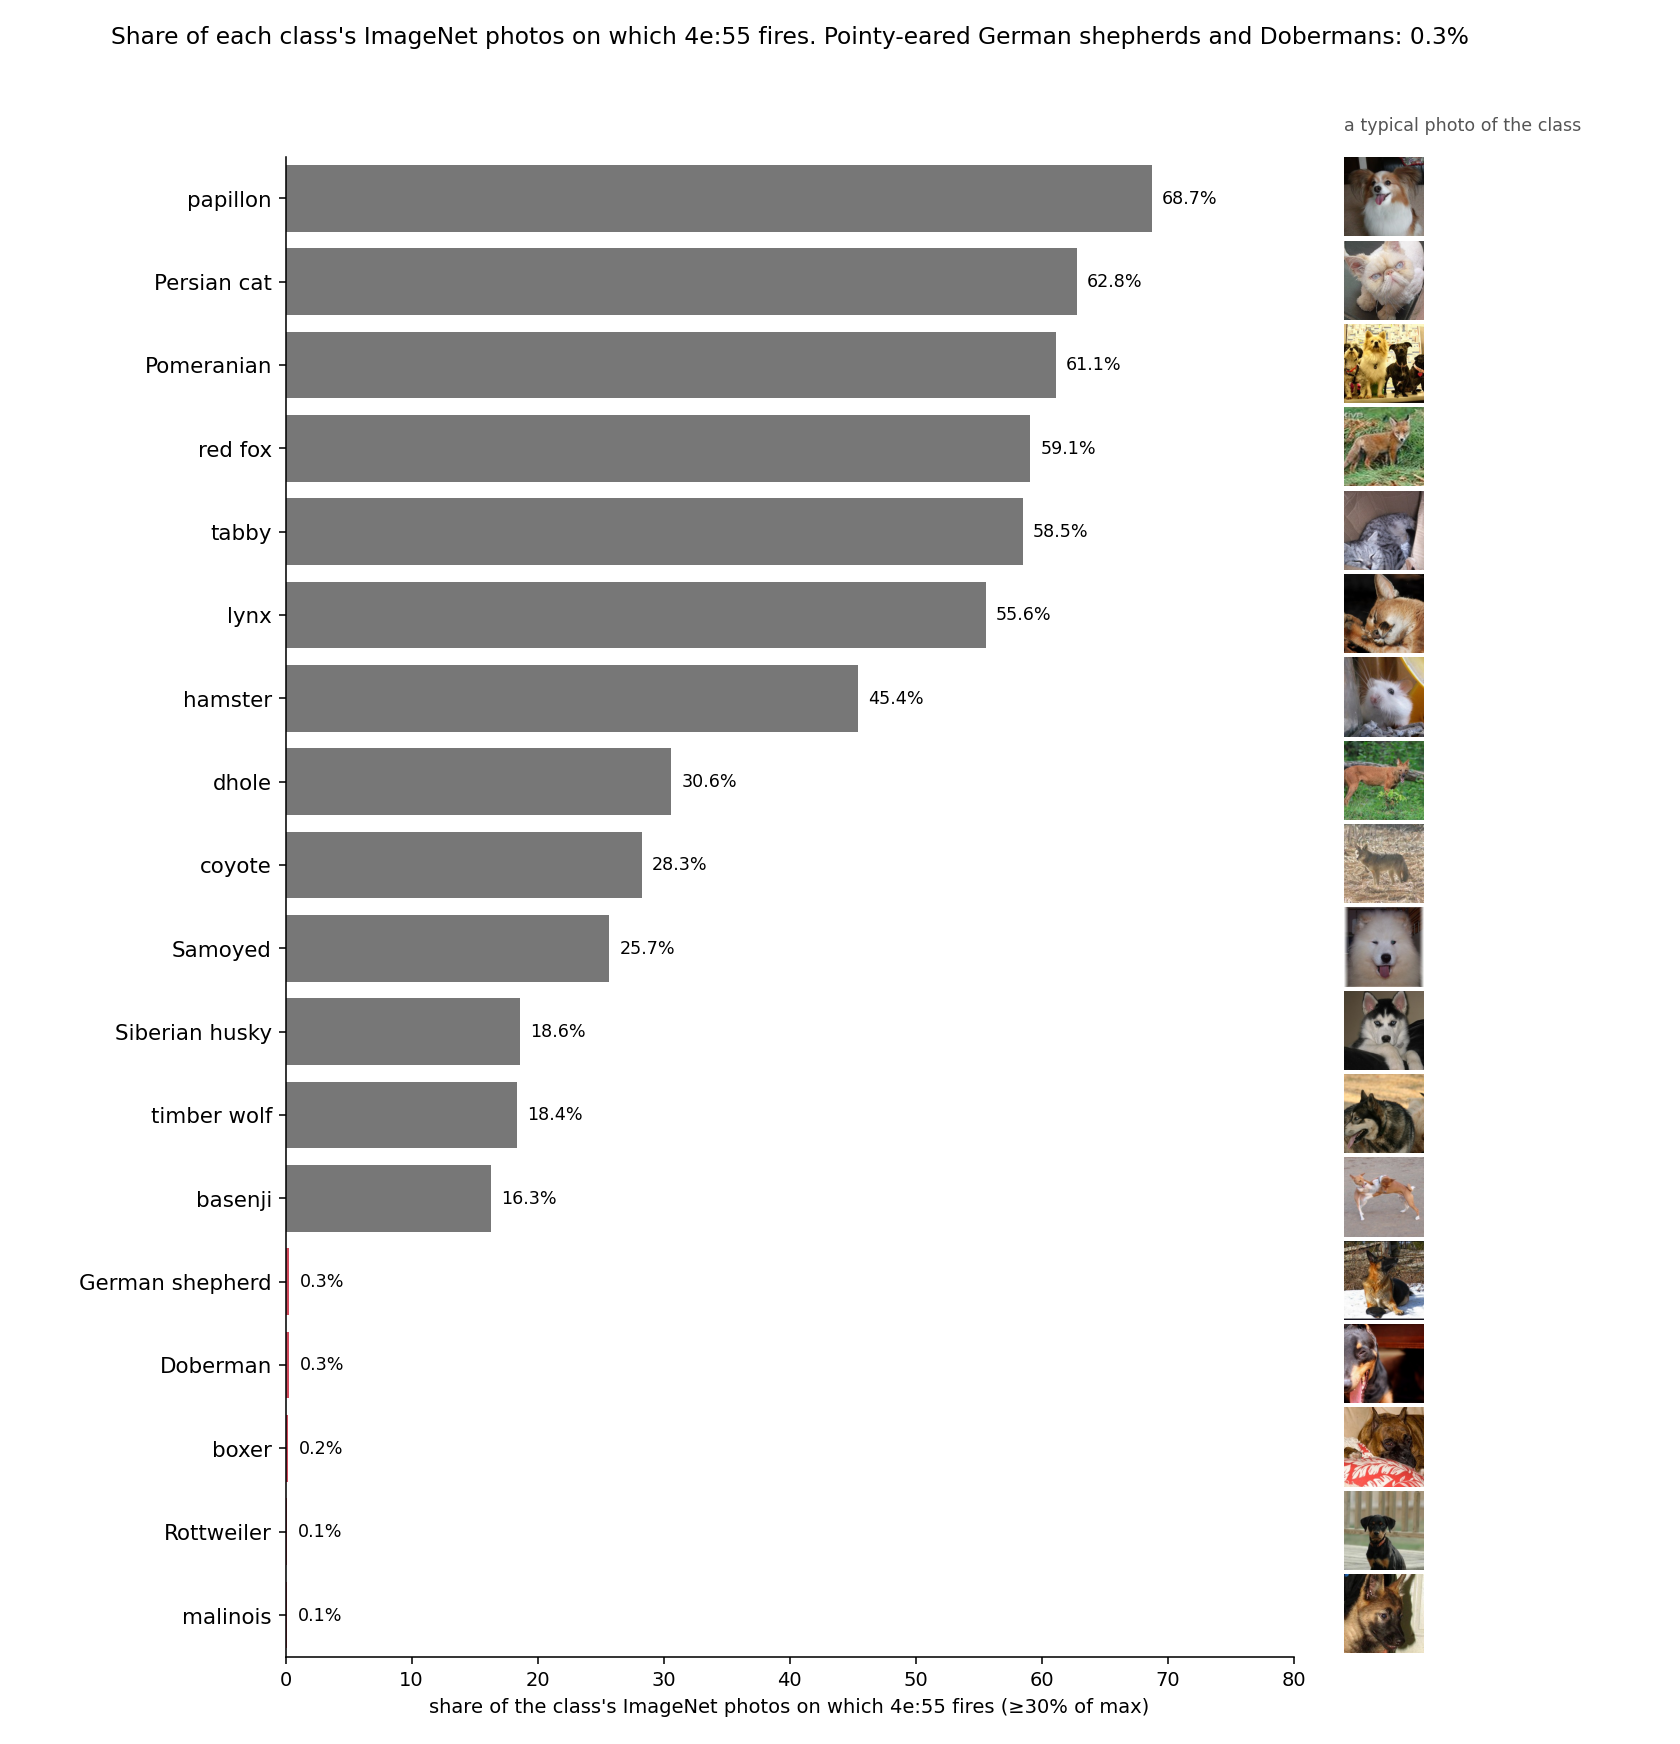
mixed4eafter the ReLU is a 14×14 map. Its value is the maximum over those 196 positions (its strongest response anywhere in the photo). - Normalization. Values are divided by the neuron's maximum over all ~1.33M photos, so 1.0 is the strongest photo in ImageNet.
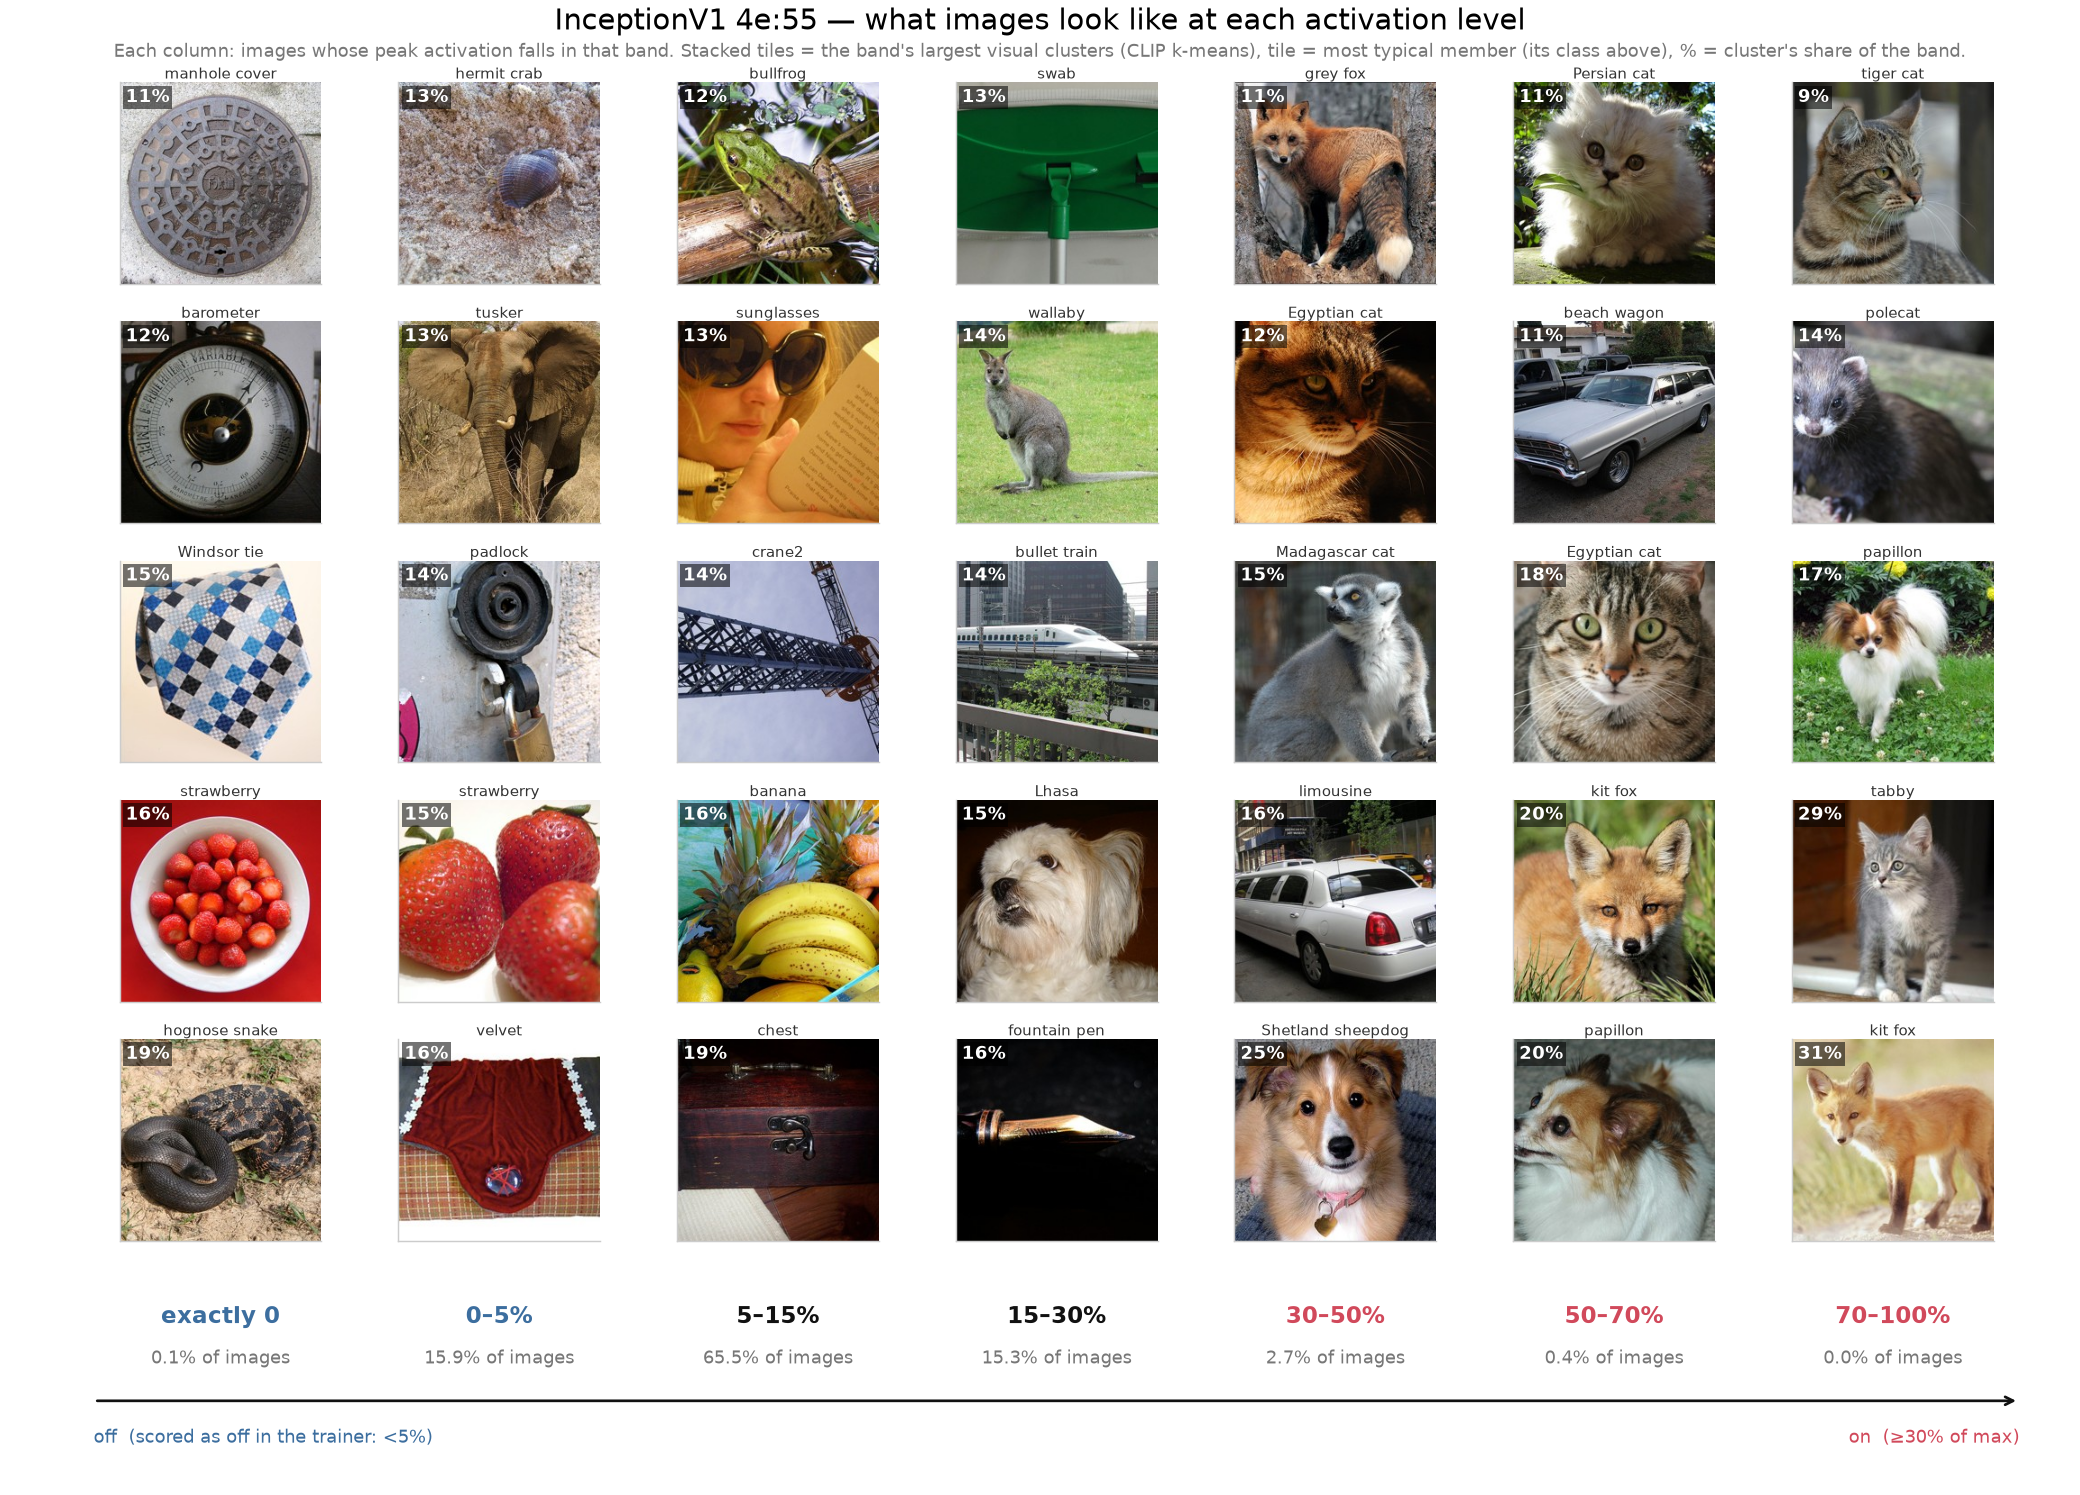
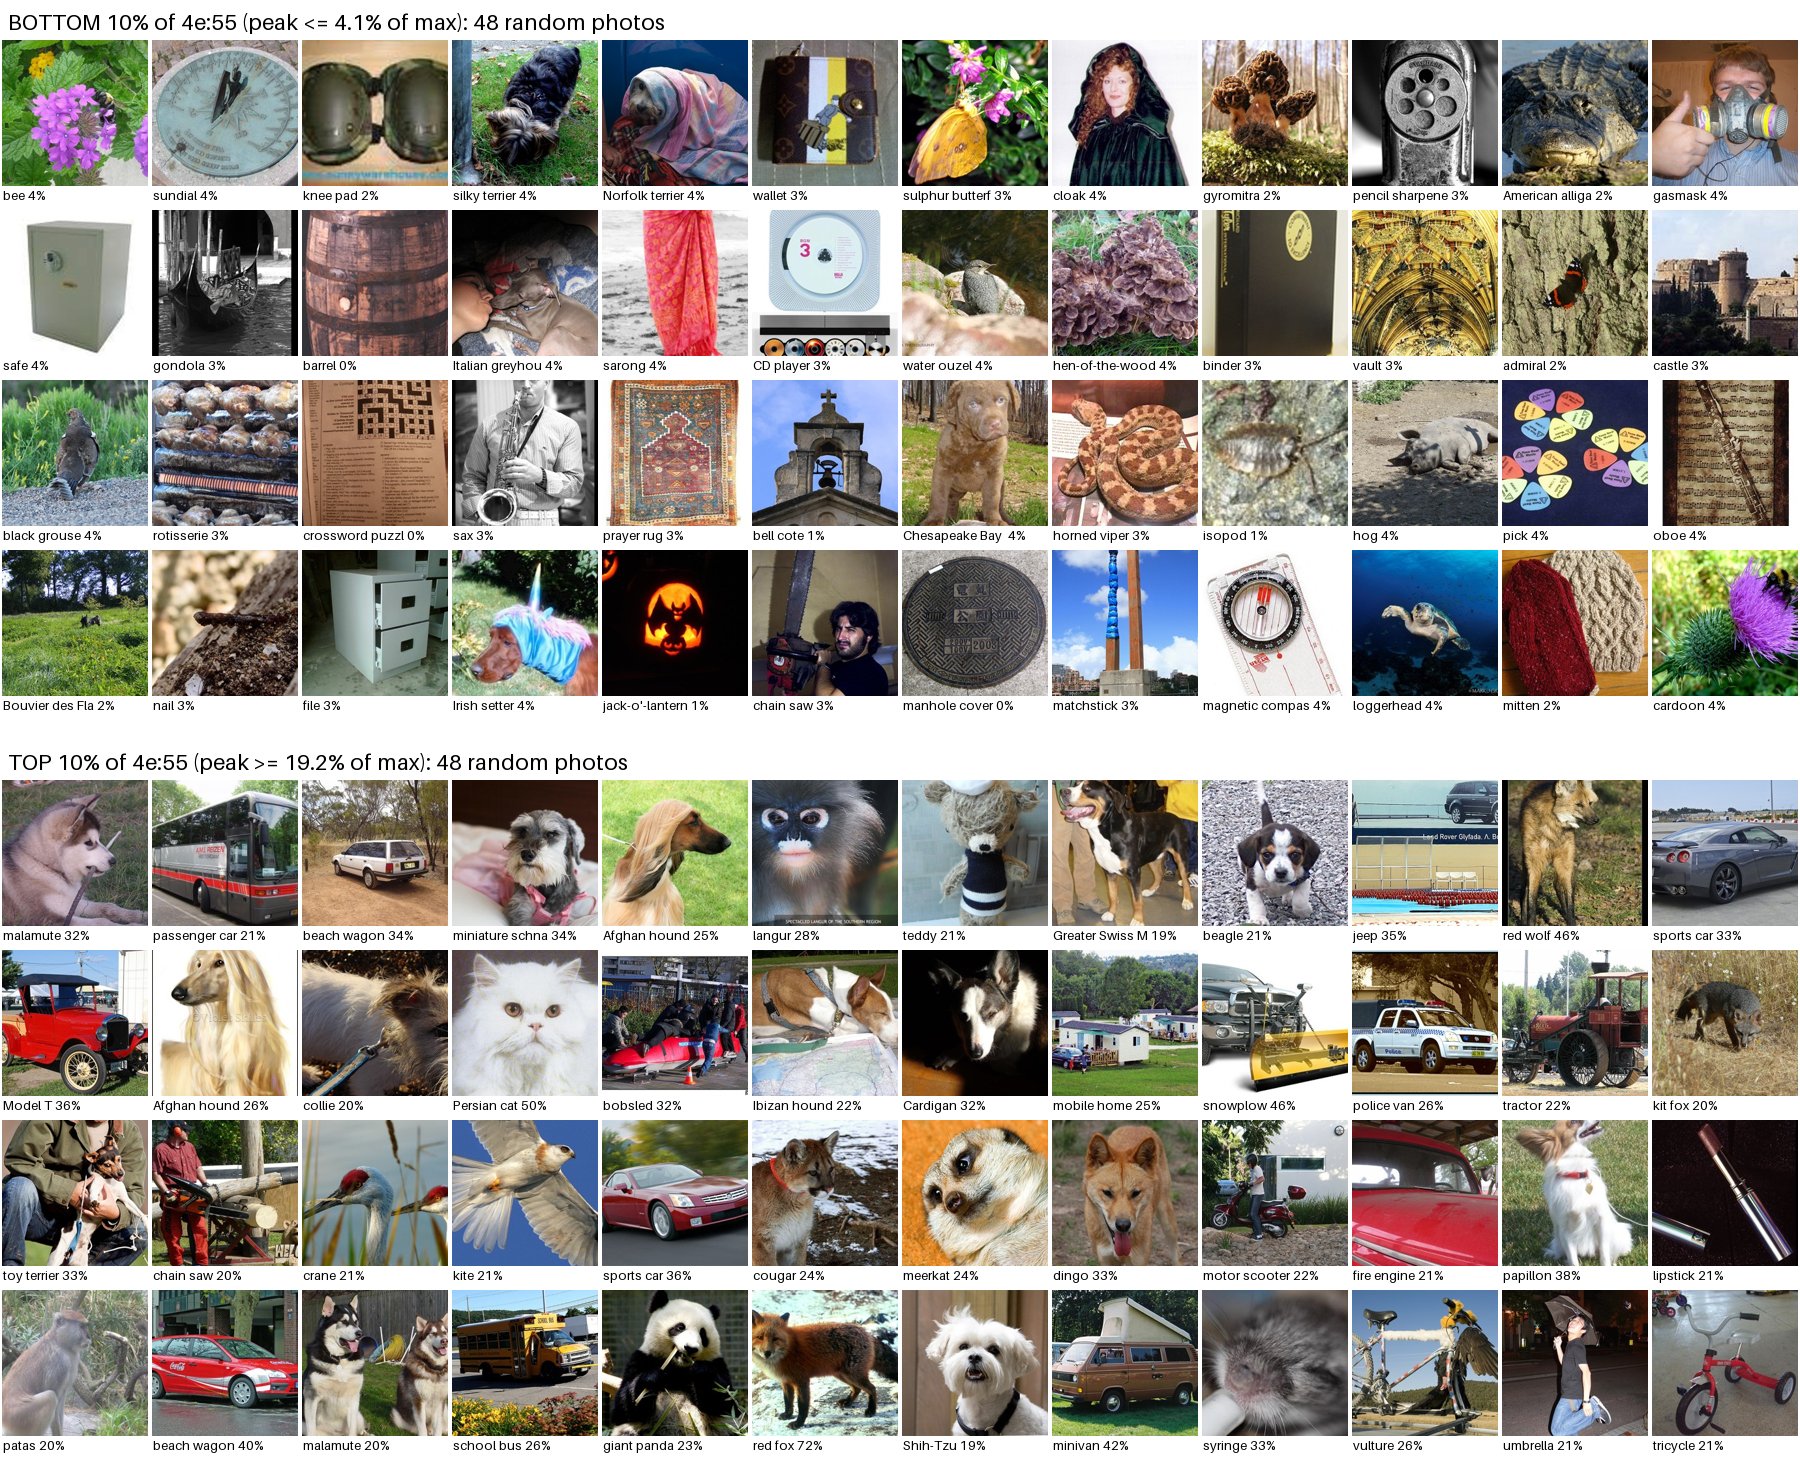
- Fires / silent. “Fires” means at least 30% of that maximum, which is the top 3.07% of training photos (the 96.9th percentile). “Silent” means under 5%, the bottom 16.1%. The 30% cutoff matches the essay's own definition of a strong response; the 5% cutoff is ours. Photos in between are left out.
- Balanced sets. Every test set has equal numbers of firing and silent photos, so guessing scores 50%.
Photo sets
Drawn at random within each half, with fixed seeds. Each set is disjoint from every set built before it.
| Set | Source | Fires | Silent | Used for |
|---|---|---|---|---|
| tune | train | 100 | 100 | scoring candidates during searches |
| select | train | 100 | 100 | choosing among search finalists |
| val | validation | 100 | 100 | every headline number on 200 photos, scored once |
| val2 | validation | 500 | 500 | the 1,000-photo essay-context comparison |
The sets are disjoint by photo, not by class: only 22% of firing val photos come from ImageNet classes with no firing photo in the tune set. Lists of every photo are in photo_sets.json.
2. How Claude predicts the neuron
Model claude-opus-5-5, effort low, max_tokens 4000. Each request contains one photo (the 224×224 crop), never
any other photo, and never the photo's label. Claude answers with a probability 0–100 that the neuron fires; “says fires” means at least 50.
Accuracy is the share of photos called correctly. AUC uses the probabilities as scores.
System prompt, with the description inserted:
You are testing how well a written description of a neuron lets someone predict it.
The neuron is a single unit inside an image-classification network. On each image it either fires strongly (ON) or barely fires (OFF).
Judge the image using only the description below. About half of all images are ON.

<description>
{description}
</description>
User turn: the photo, then What is the probability (0-100) that the neuron is ON for this image? Answer with only the number.
One answer across all description runs had no number. It is stored as null and counted as “silent”.
3. Result 1: one-sentence descriptions
All on the same 200 val photos, each scored once.
| Description | Accuracy | AUC | Fires called fires | Silent called silent |
|---|---|---|---|---|
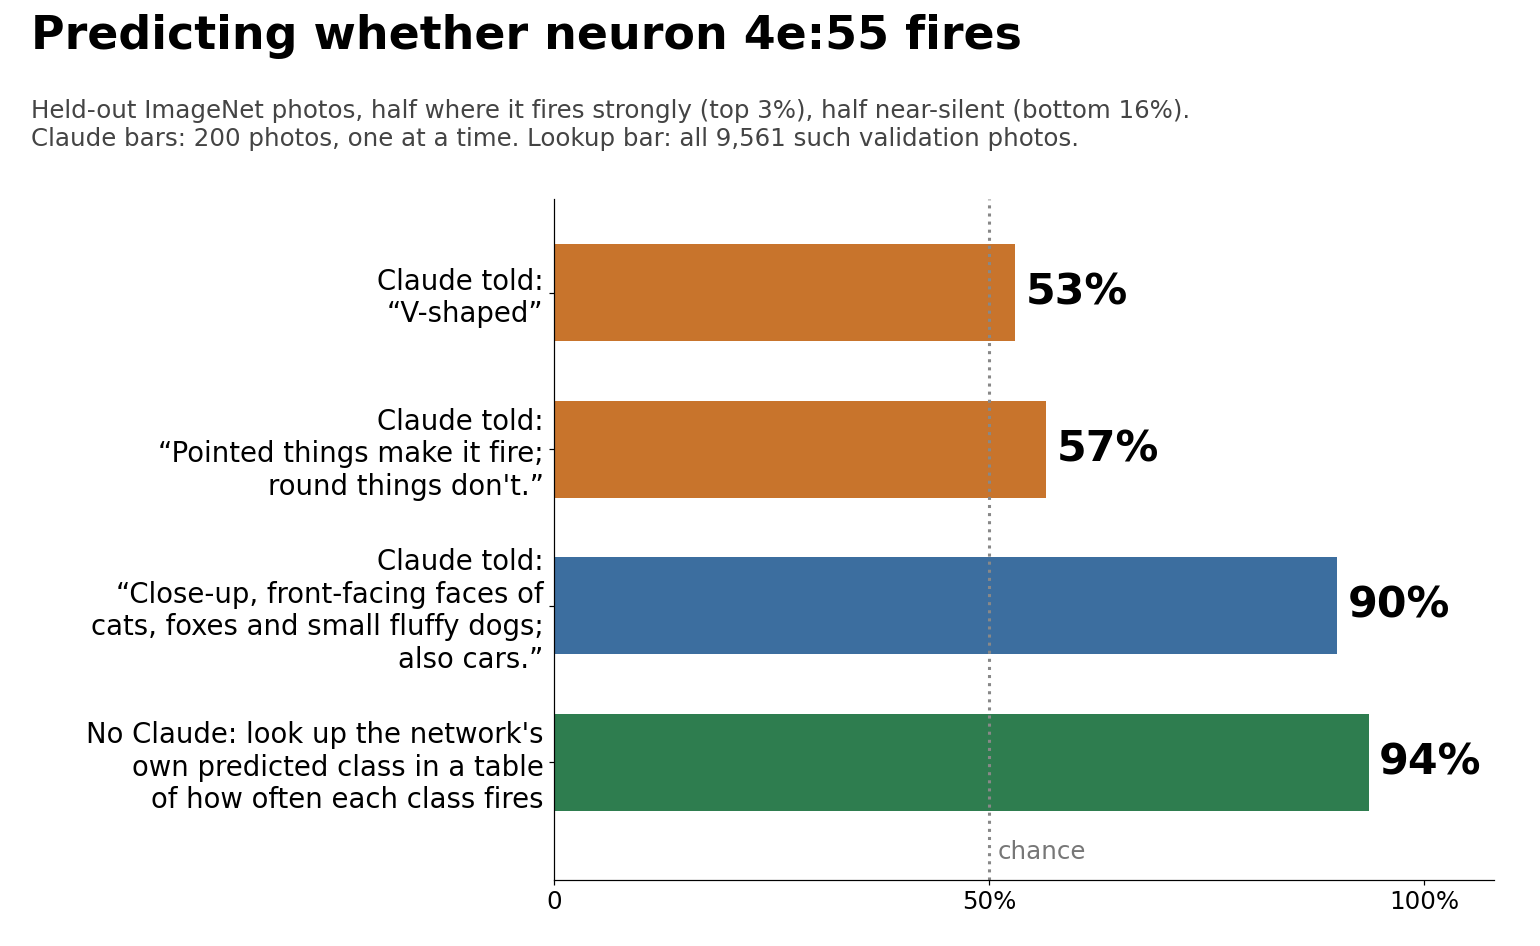
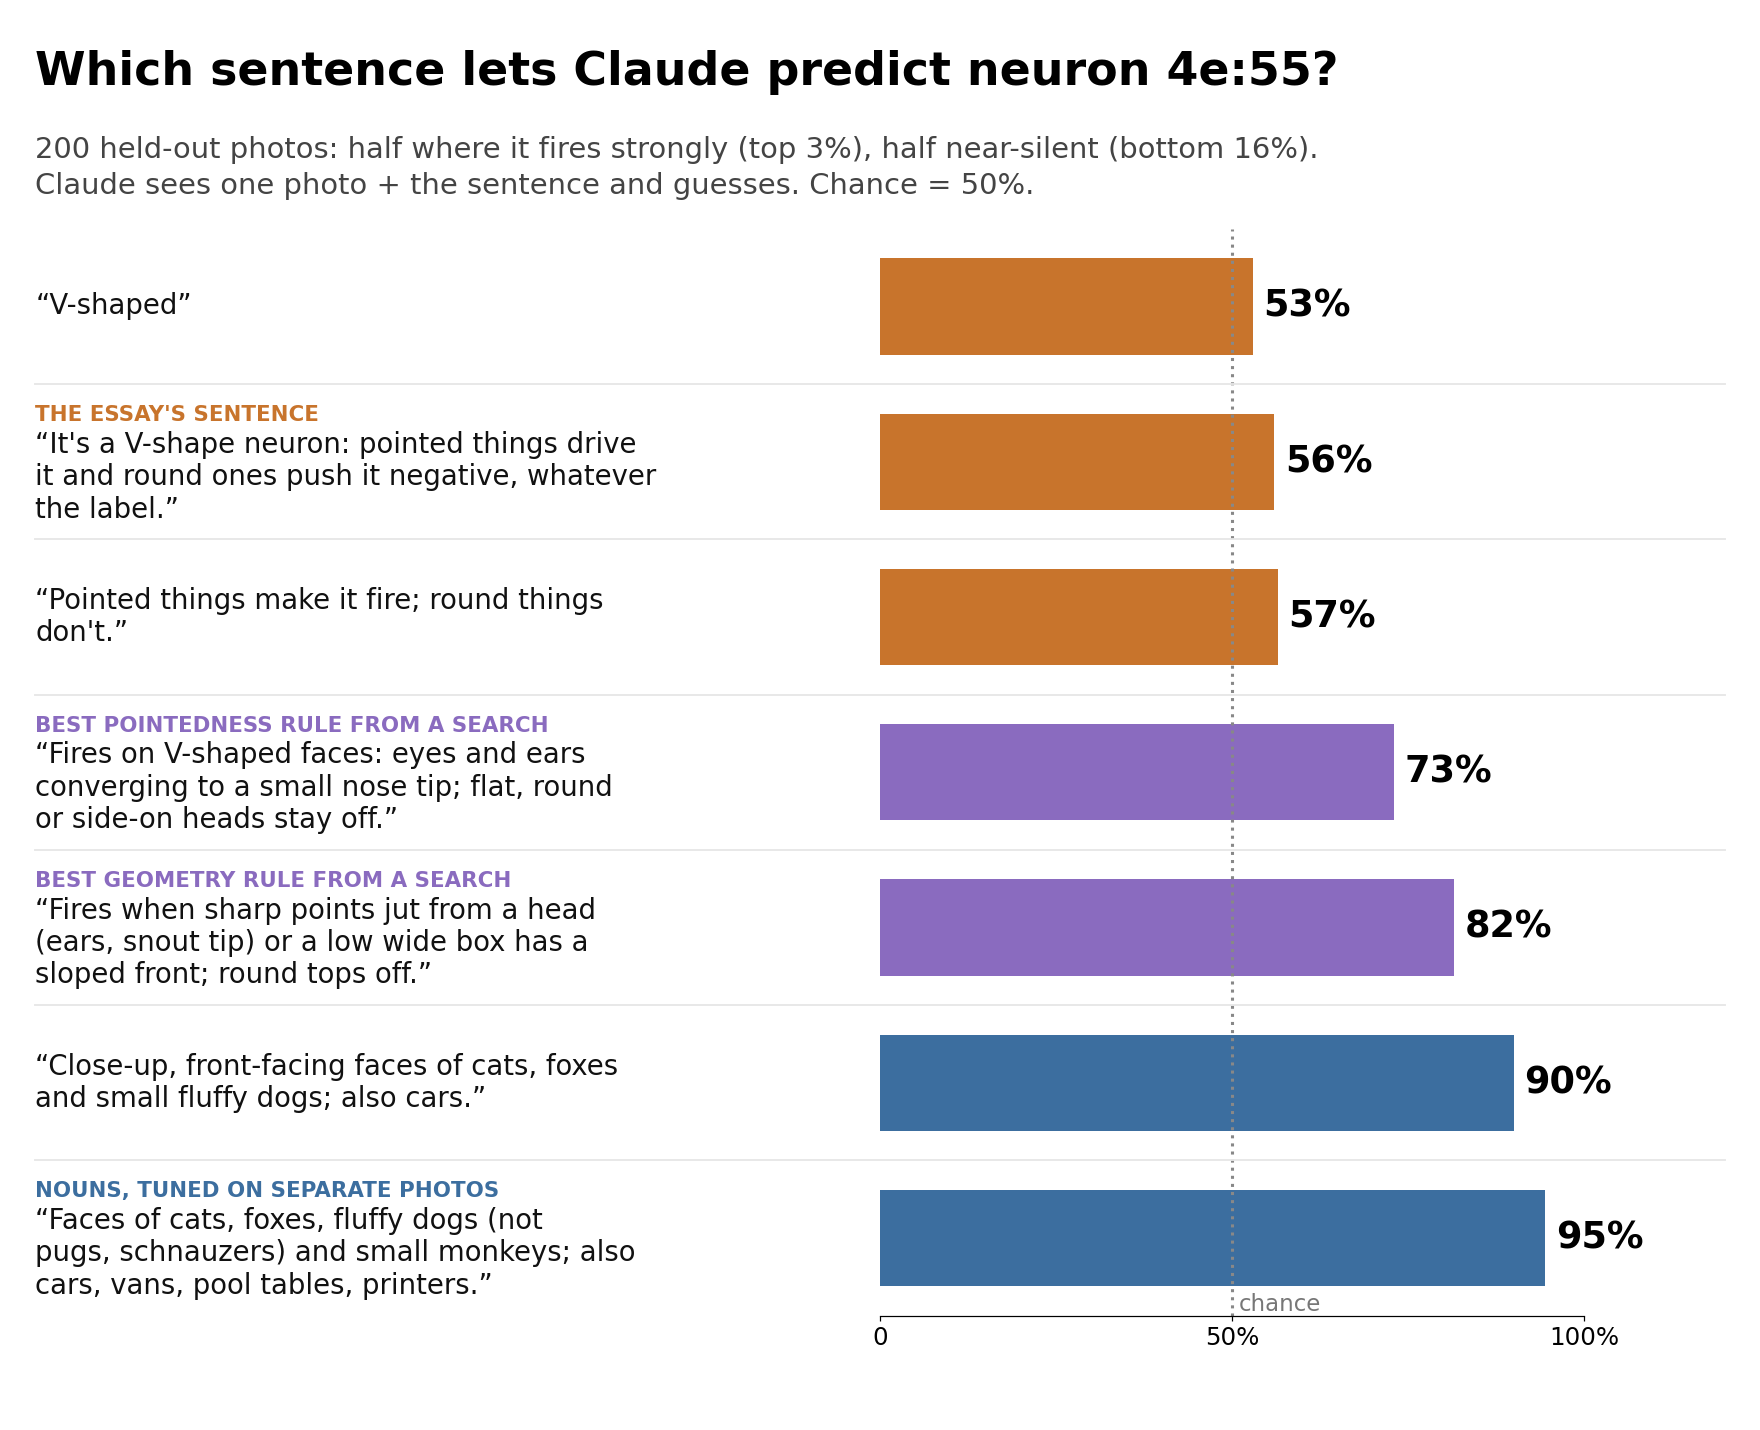
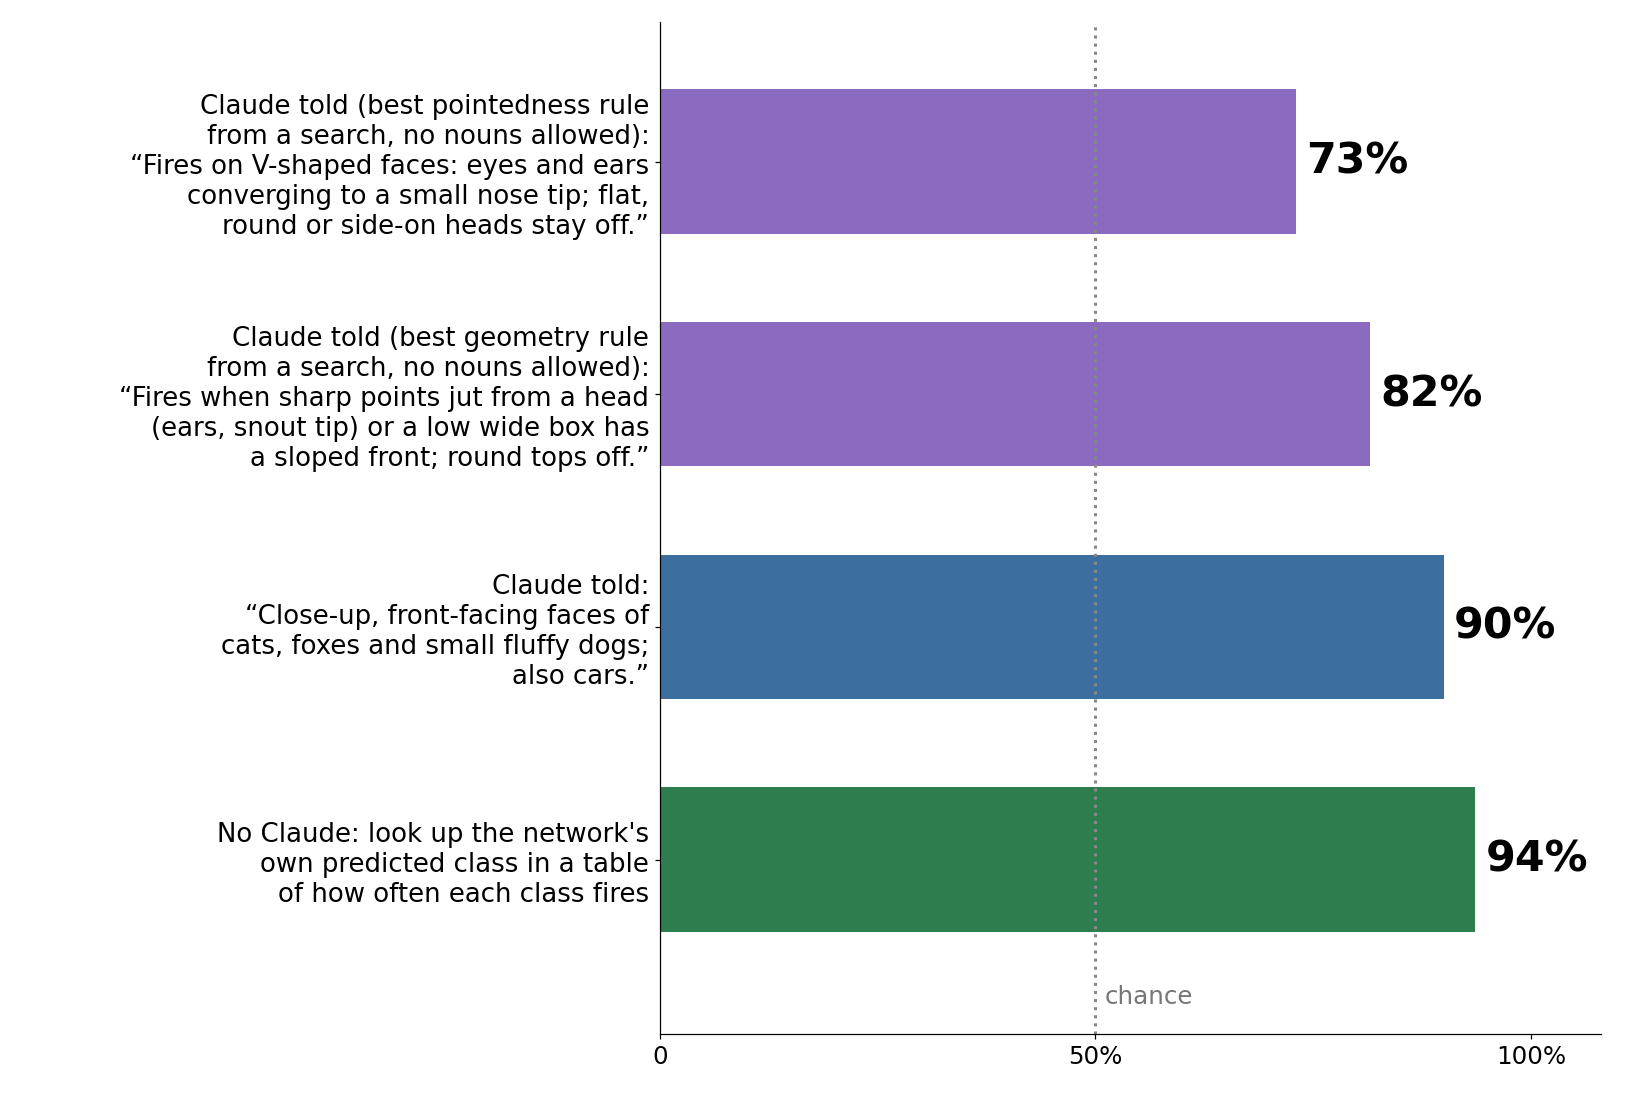
| “V-shaped” | 53.0% | 0.57 | 39/100 | 67/100 |
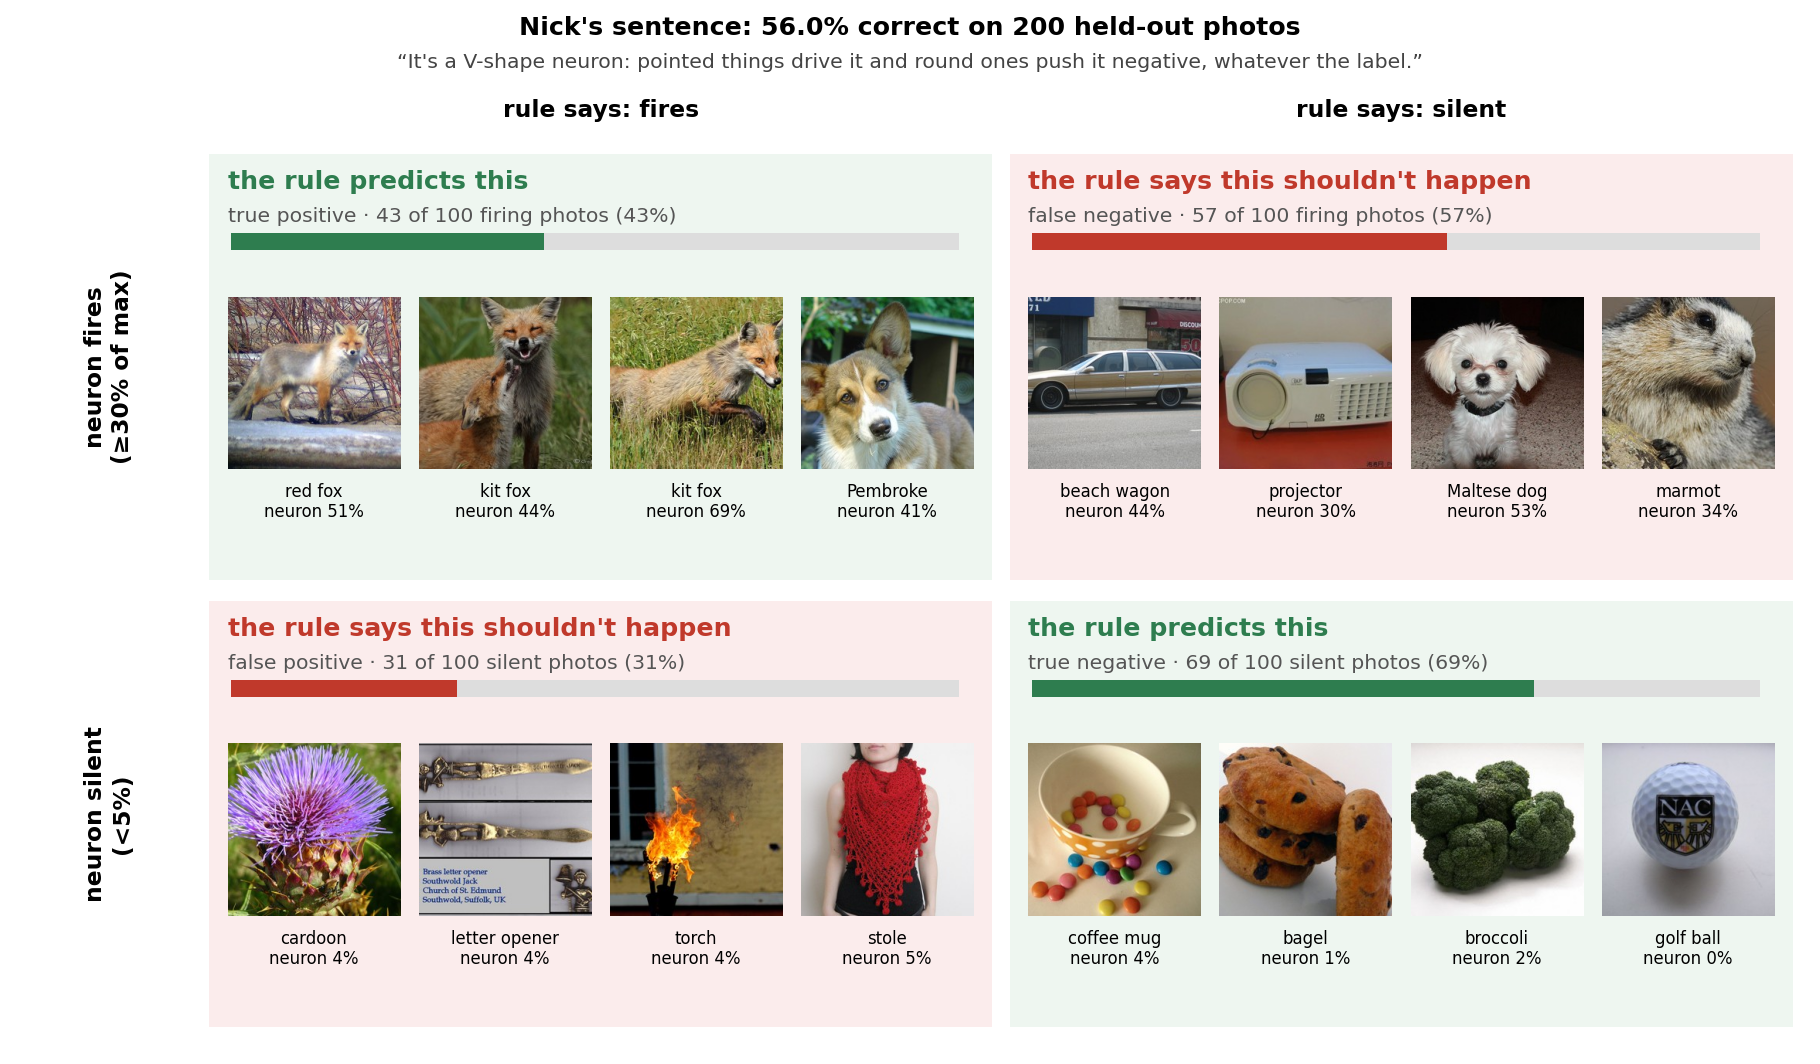
| “It's a V-shape neuron: pointed things drive it and round ones push it negative, whatever the label.” (the essay's sentence) | 56.0% | 0.60 | 43/100 | 69/100 |
| “Pointed things make it fire; round things don't.” | 56.5% | 0.59 | 41/100 | 72/100 |
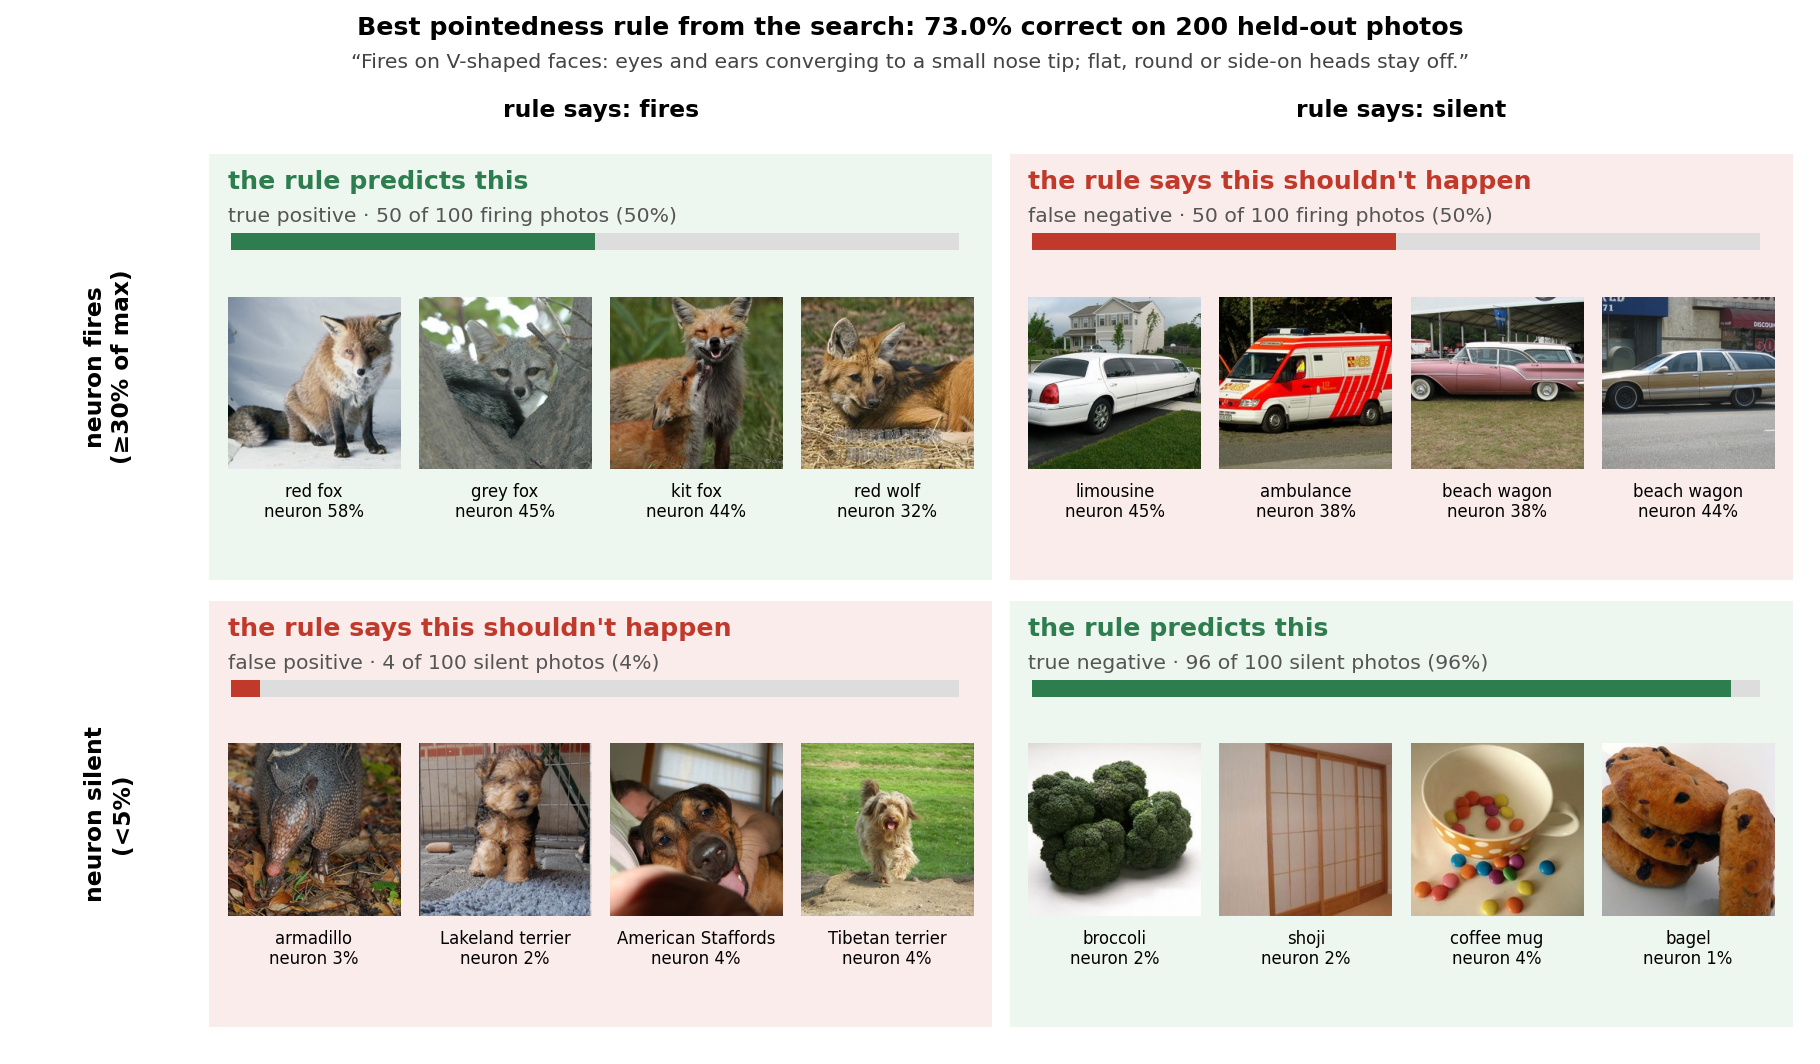
| “Fires on V-shaped faces: eyes and ears converging to a small nose tip; flat, round or side-on heads stay off.” (best pointedness rule from the search, §4) | 73.0% | 0.73 | 50/100 | 96/100 |
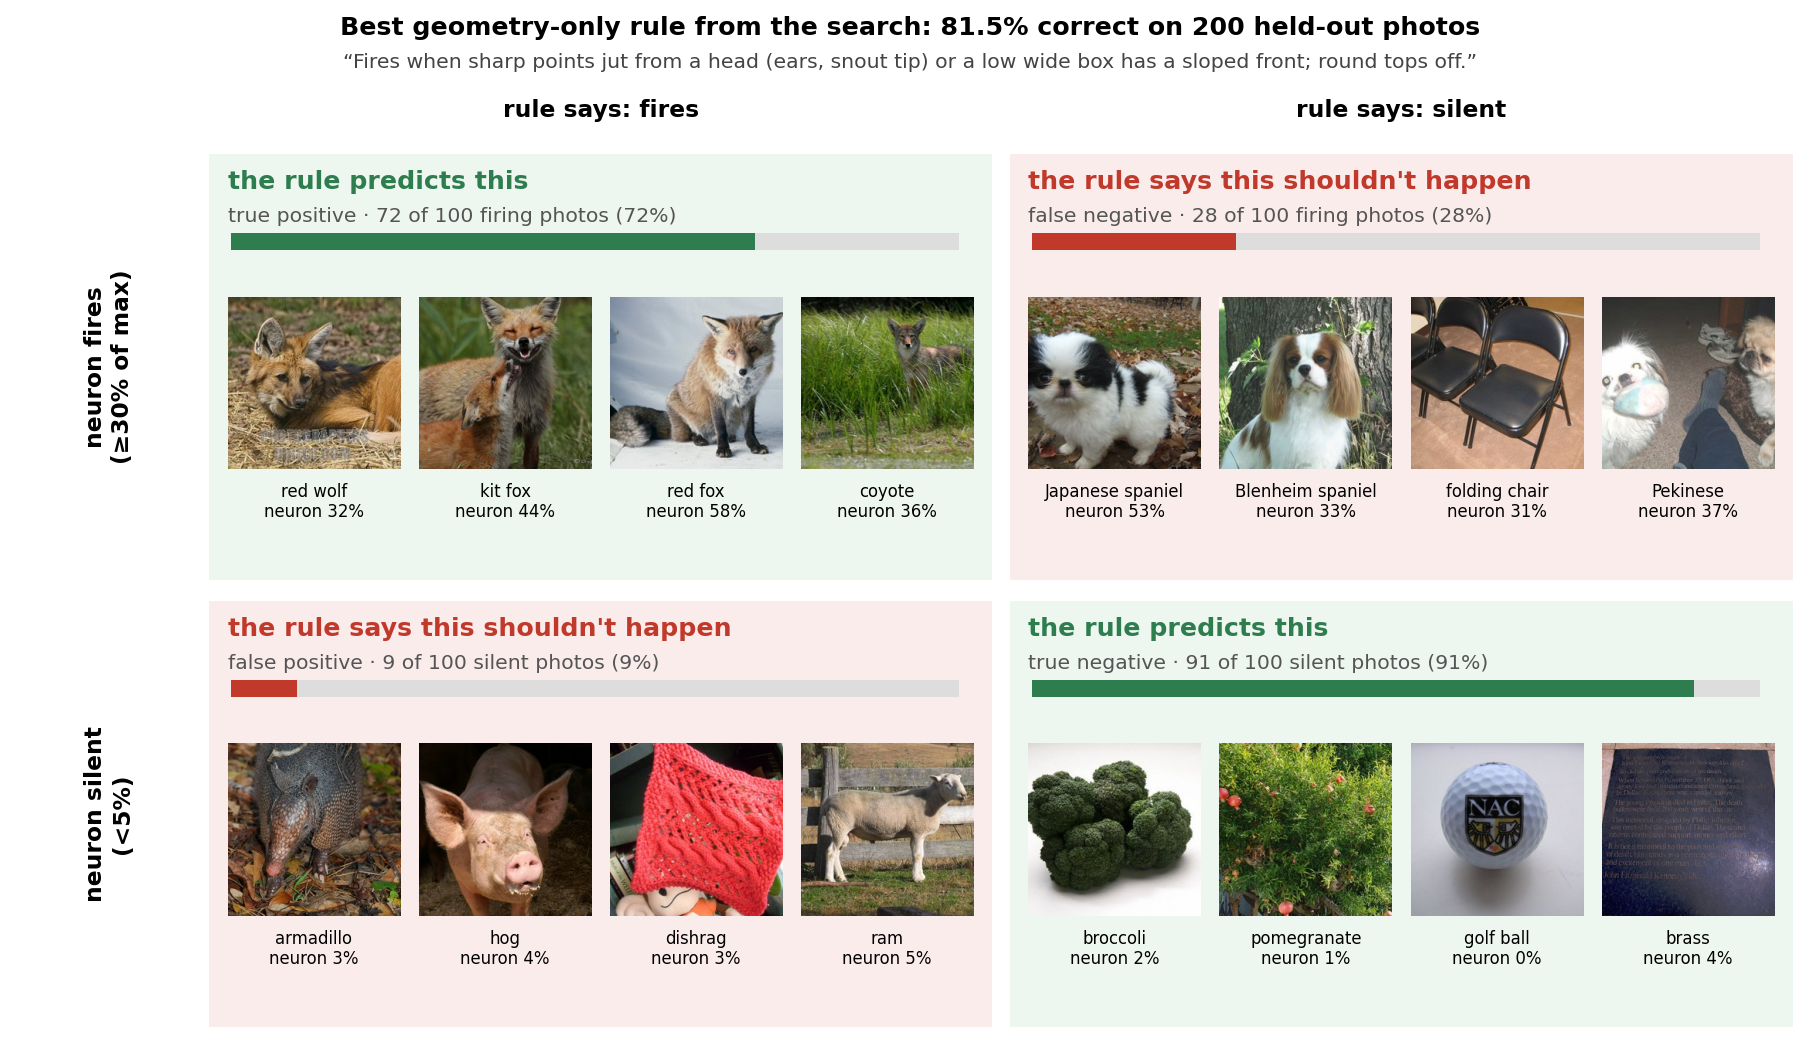
| “Fires when sharp points jut from a head (ears, snout tip) or a low wide box has a sloped front; round tops off.” (best geometry rule from the search, §4) | 81.5% | 0.89 | 72/100 | 91/100 |
| “Close-up, front-facing faces of cats, foxes and small fluffy dogs; also cars.” | 90.0% | 0.95 | 87/100 | 93/100 |
| “Faces of cats, foxes, fluffy dogs (not pugs, schnauzers) and small monkeys; also cars, vans, pool tables, printers.” (tuned, §4) | 94.5% | 0.98 | 94/100 | 95/100 |
With 200 photos, an accuracy has a 95% confidence interval of roughly ±6–7 points.
The thread's first image (hand-picked)
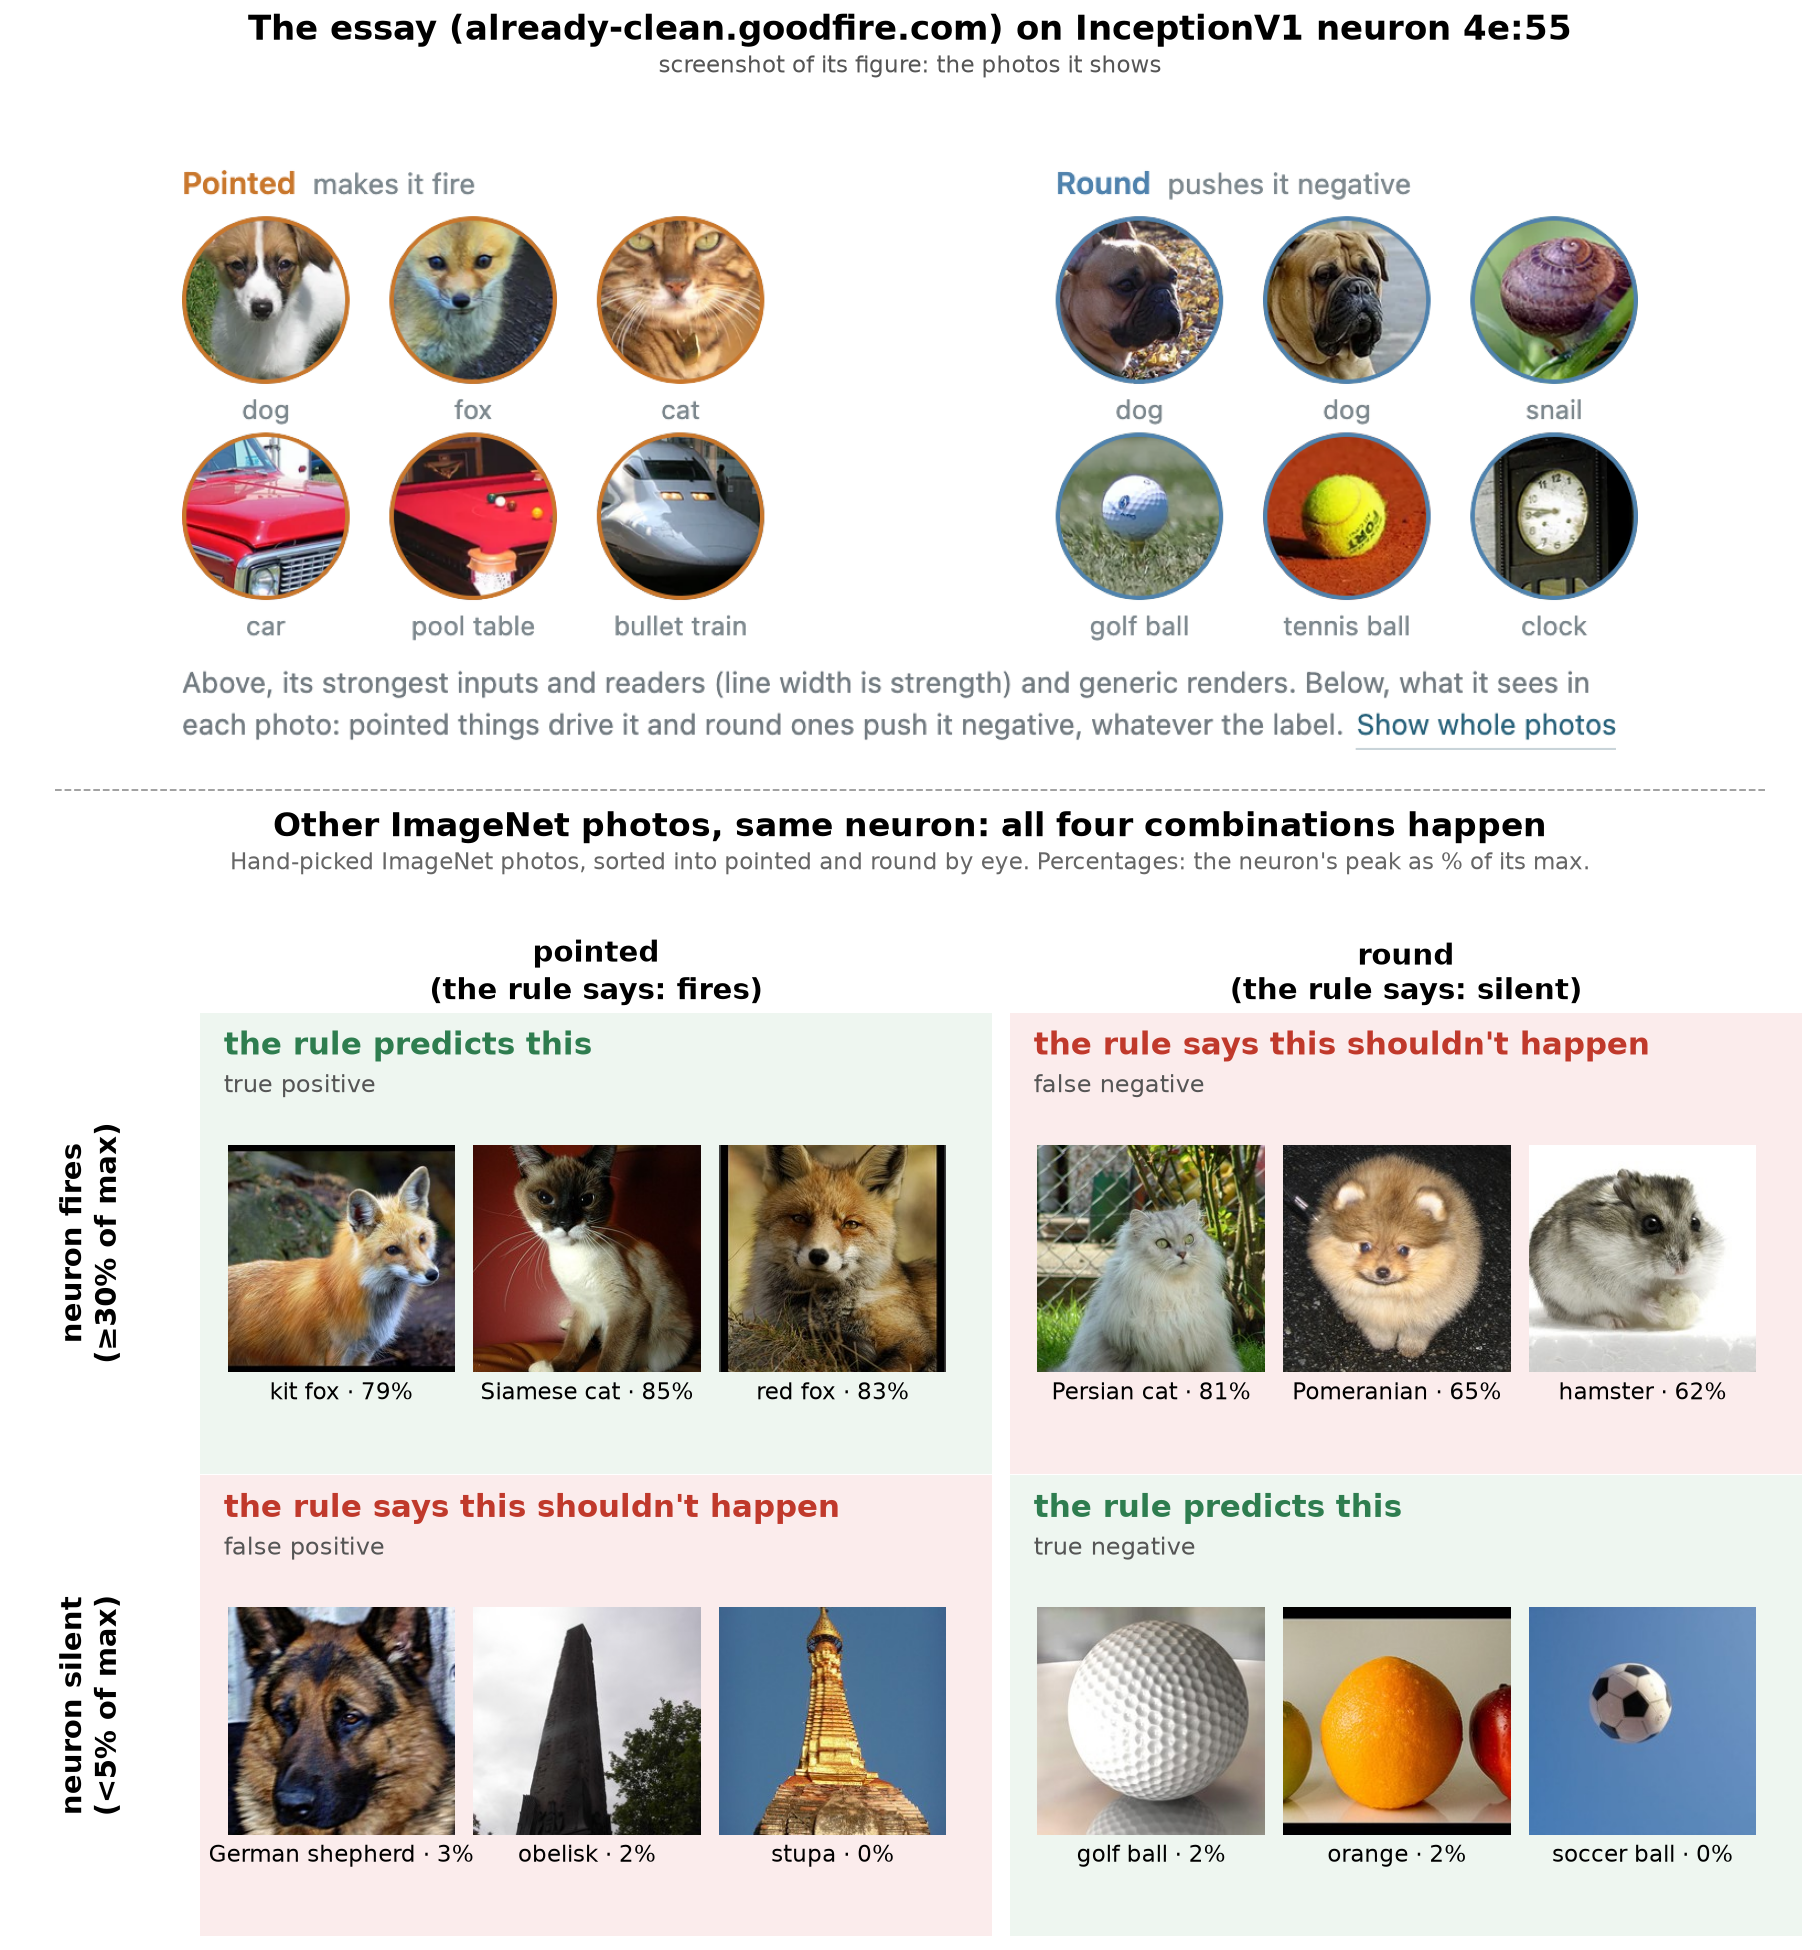
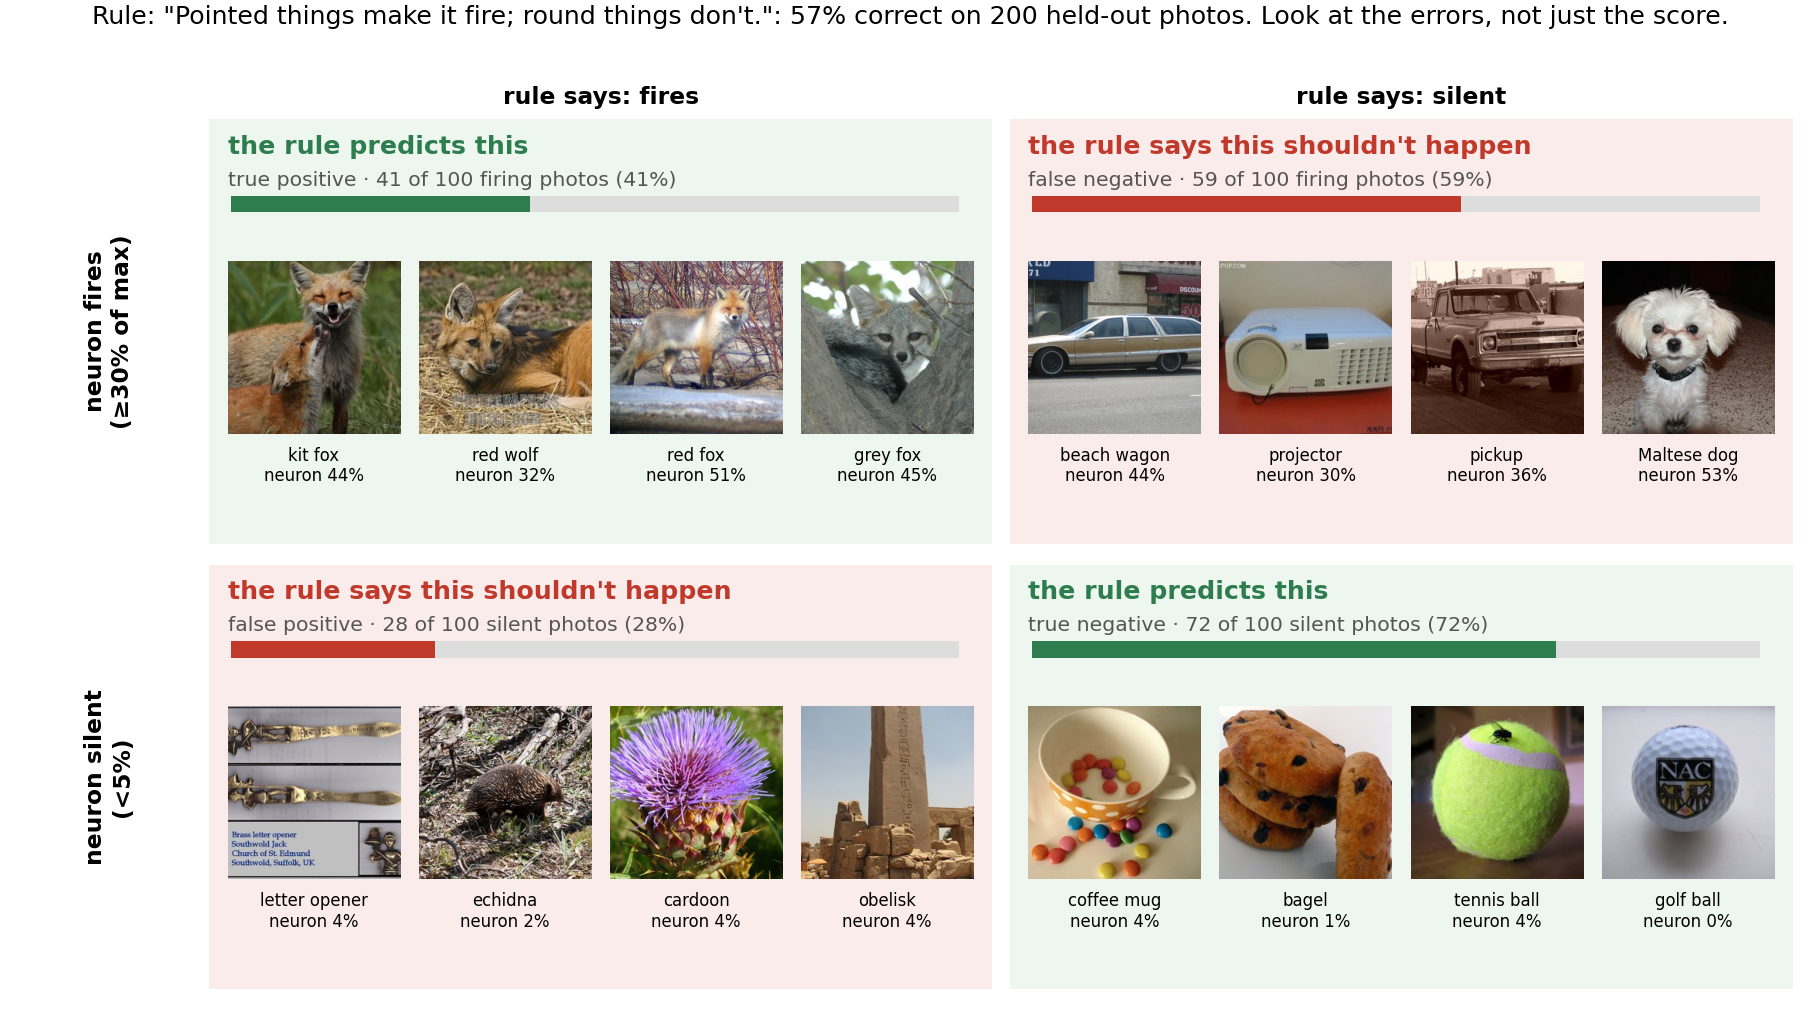
This image is an illustration, not a measurement. We picked the photos by hand to show that all four combinations of pointed/round and fires/silent exist, and sorted them into pointed and round by eye. Rows use the measured value and the cutoffs from §1; columns are what the essay's rule predicts (pointed: fires, round: silent). How often each combination happens is what the measured results measure: the same grid for Claude given the essay's sentence, on 200 photos nobody picked, is below (56% correct).
| Photo | gid | Sorted as | Value (% of max) | Neuron |
|---|---|---|---|---|
| kit fox | 591816 | pointed | 79.2% | fires |
| Siamese cat | 659851 | pointed | 84.8% | fires |
| red fox | 396688 | pointed | 83.1% | fires |
| Persian cat | 382670 | round | 81.5% | fires |
| Pomeranian | 328210 | round | 65.1% | fires |
| hamster | 853275 | round | 62.2% | fires |
| German shepherd | 727517 | pointed | 2.6% | silent |
| obelisk | 1278449 | pointed | 2.5% | silent |
| stupa | 557092 | pointed | 0.0% | silent |
| golf ball | 610076 | round | 1.8% | silent |
| orange | 1126419 | round | 1.9% | silent |
| soccer ball | 709969 | round | 0.0% | silent |
Labels in the image round the value to a whole percent. Script: quad_handpicked.py (not published; it only lays out the photos above).
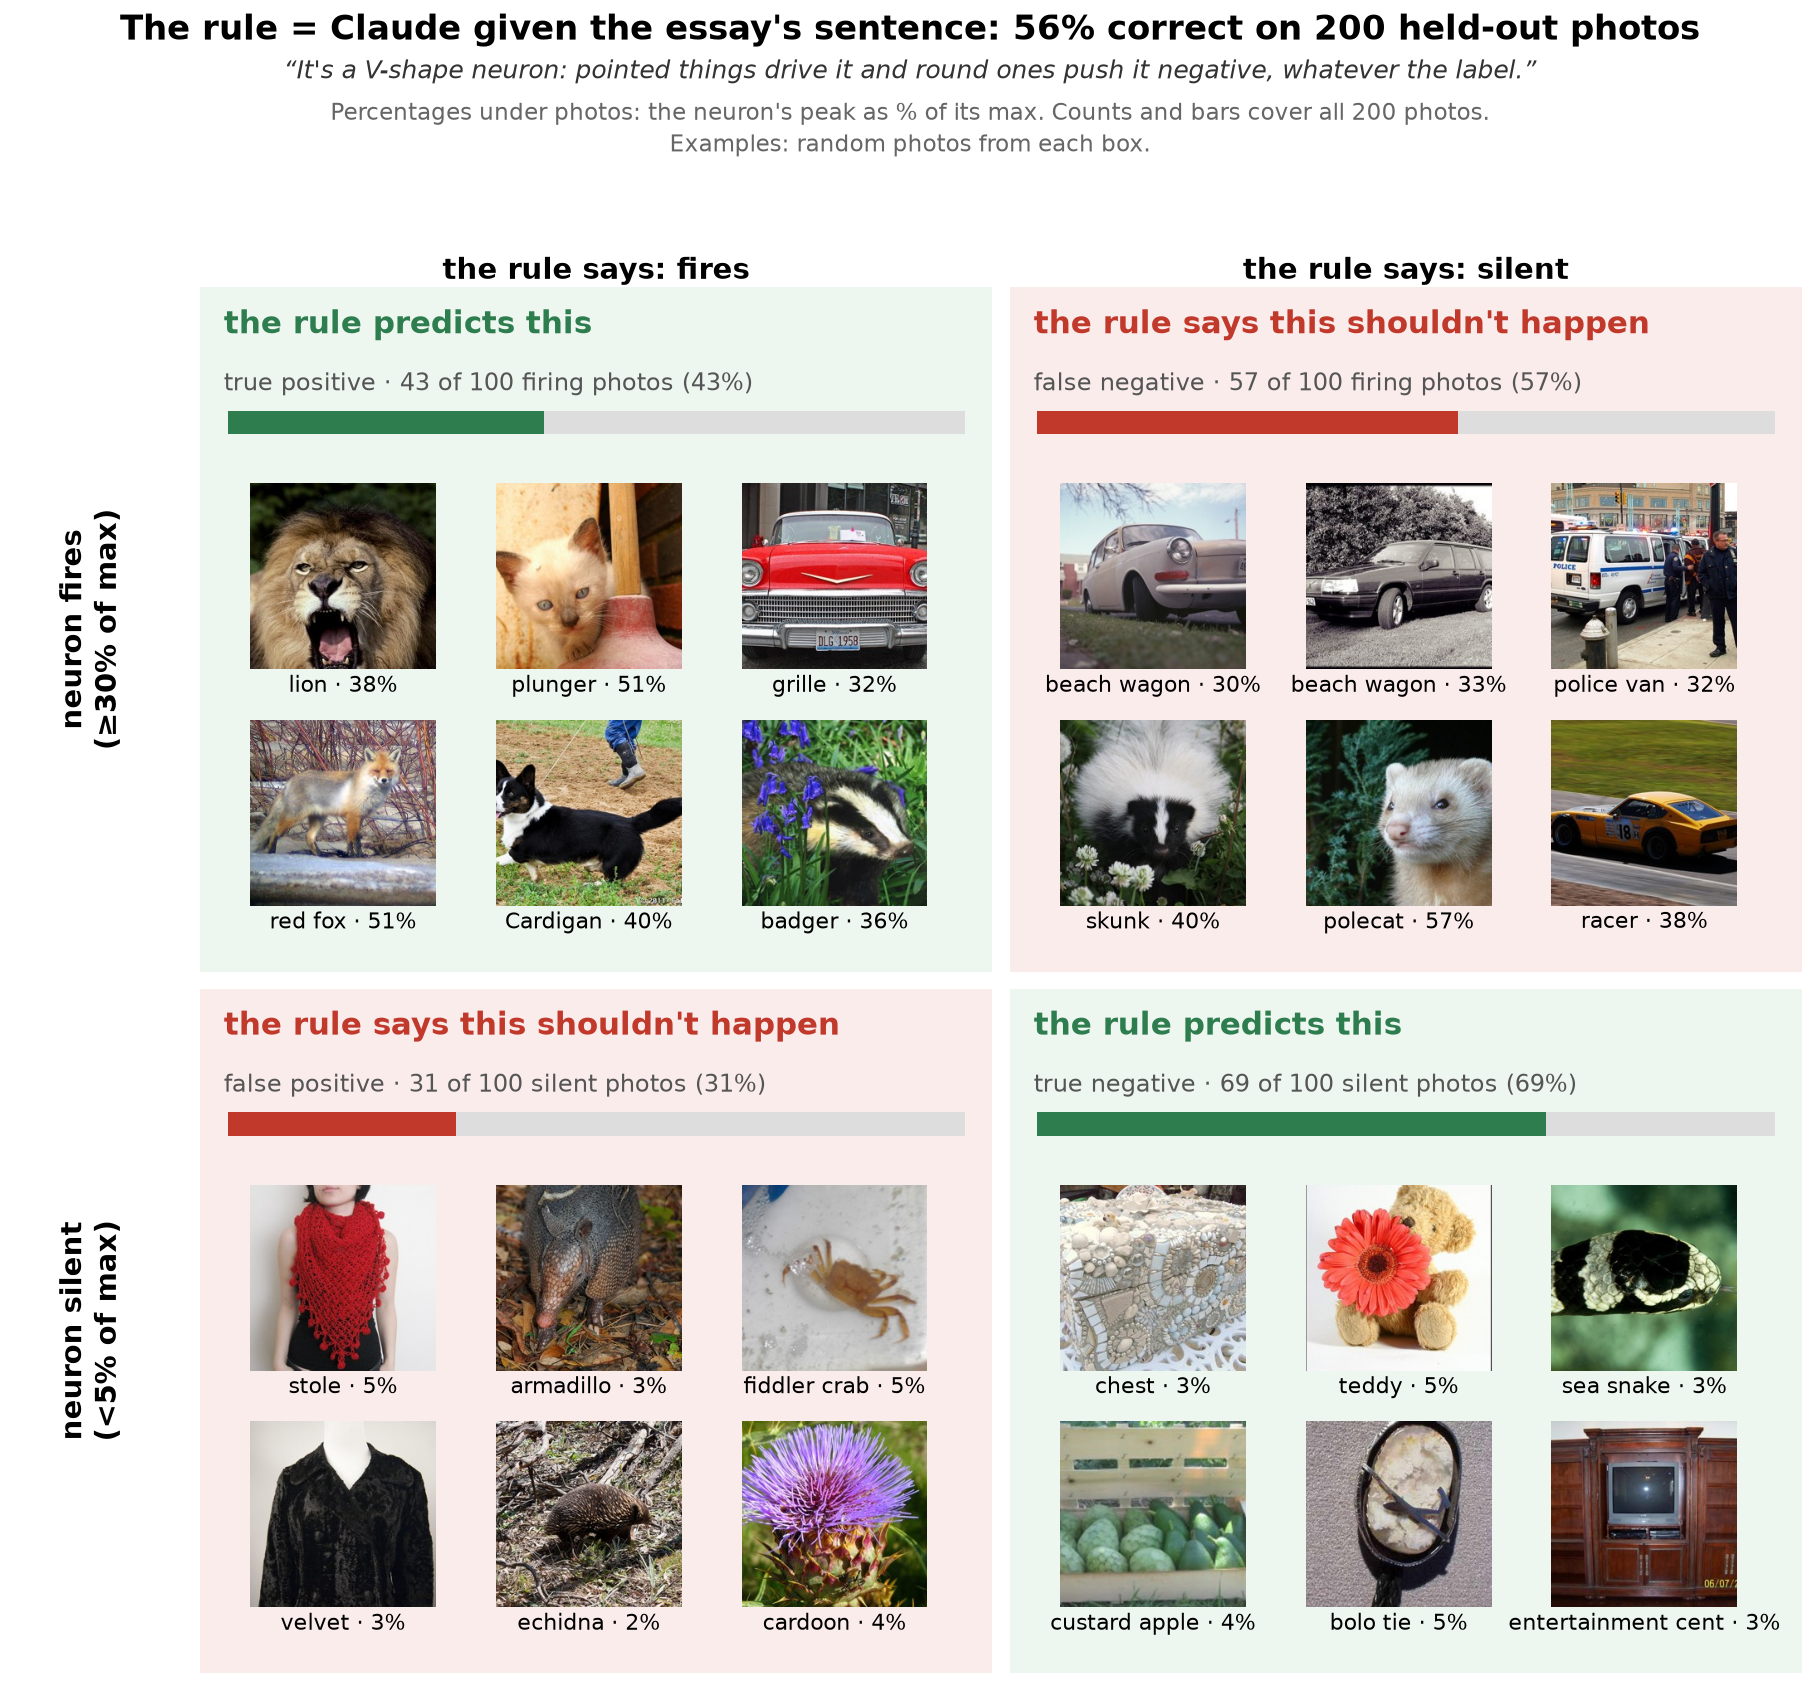
Car fronts. The essay's figure lists a car under “pointed”, and one of the neuron's inputs it shows is “van front”. Claude reading the essay's sentence disagrees: of the 24 firing car photos in val (pickup, beach wagon, minivan, limousine, cab, racer, RV, police van, car wheel, grille), it calls 1 “fires”; “Pointed things make it fire; round things don't.” calls 0. So the same words, read carefully, give a different rule than the one in the author's head, which is one reason a written hypothesis is hard to test.
4. Result 2: searching for the best shape rule
To give the essay's idea its best shot, Claude searched for the strongest rule in its spirit.
- Allowed words. Geometry (points, V's, tapering, convergence, angles, roundness, curvature, symmetry, orientation, scale) plus generic part words (face, head, ears, eyes, nose, snout, muzzle, front, tip, edge).
- Blocked words, enforced by this check on every candidate:
\b(cats?|kitten|fox(es)?|dogs?|pupp(y|ies)|wol(f|ves)|cars?|vans?|trucks?|vehicles?|bus|train|tables?|animals?|mammals?|pets?|birds?|monkeys?|
breeds?|terriers?|spaniels?|pug|machines?|fur(ry)?|fluff(y)?|hair|glossy|shiny|sheen|gleam\w*|metal|paint\w*|orange|red|white|black|
colou?r\w*|textur\w*|soft|cute|creature)\b
- Each round. Claude (Opus 5.5, adaptive thinking) saw the essay's claim, these constraints, the best candidates so far with their tune accuracy and error lists, and 24 labelled tune photos, mostly current errors. It proposed 6 new rules of at most 115 characters. Candidates were scored on the tune set with the judge in §2.
- Two tracks. “Pointedness”: rules must stay about points, V's or tapering (18 candidates). “Geometry”: any geometric property (20 candidates, counting the starting sentences).
- Selection. The top candidates were scored on the select set; the best of each track was scored once on val.
| Finalist | Select | Val |
|---|---|---|
| Geometry: “Fires when sharp points jut from a head (ears, snout tip) or a low wide box has a sloped front; round tops off.” | 83.0% | 81.5% |
| Geometry: “Fires on heads with pointed ears or a tapering muzzle, and on long low boxes; droopy round heads stay off.” | 82.0% | — |
| Pointedness: “Fires on V-shaped faces: eyes and ears converging to a small nose tip; flat, round or side-on heads stay off.” | 75.5% | 73.0% |
| Pointedness: “Fires when edges taper to a point at the front of a long low shape or a face; …” | 72.0% | — |
| Essay's sentence (reference) | 52.5% | 56.0% |
| “Pointed things make it fire; round things don't.” (reference) | 55.5% | 56.5% |
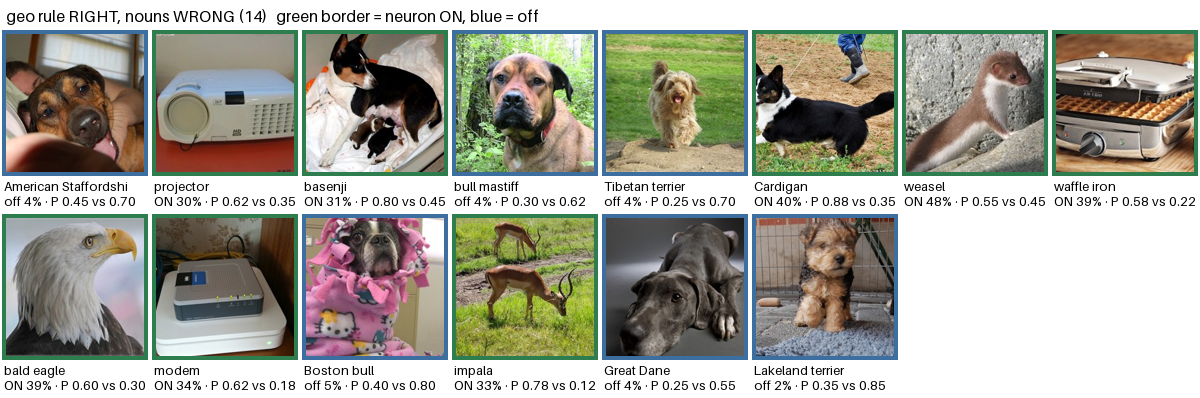
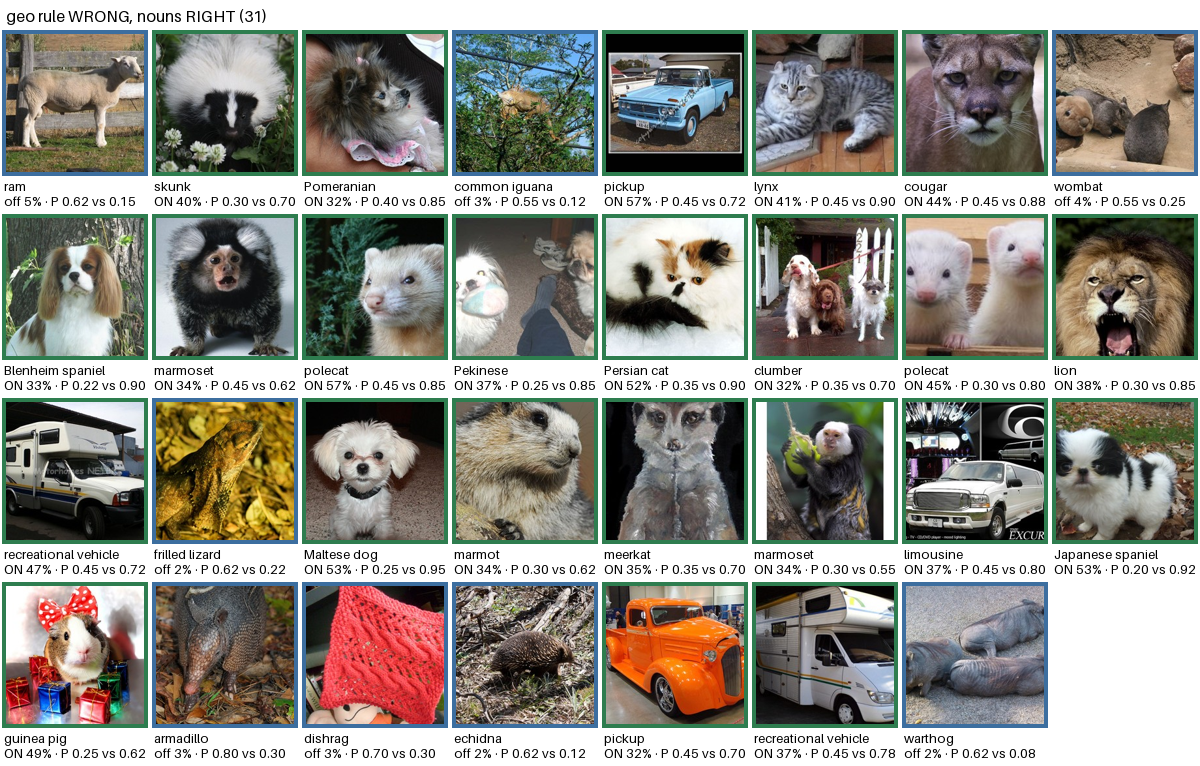
The best geometry rule gets most of its accuracy by describing the two categories in disguise: “sharp points jutting from a head” covers pointy-eared animals, “a low wide box with a sloped front” covers cars. It still misses round fluffy faces and fires on armadillos, hogs and lizards.
Four-quadrant grids for the searched rules and the essay's sentence
Tuning the noun sentence
The same loop, without word restrictions and with a length cap of 1.5× the original sentence (115 characters): 12 candidates scored on tune, 5 finalists on select, the winner scored once on val. Original: 88.0% select, 90.0% val. Winner: “Faces of cats, foxes, fluffy dogs (not pugs, schnauzers) and small monkeys; also cars, vans, pool tables, printers.”, 92.5% select, 94.5% val. Every candidate and its per-photo probabilities are in description_runs.json.
5. Result 3: giving Claude the essay
Does the essay's explanation help a judge beyond what Claude already knows about this famous neuron?
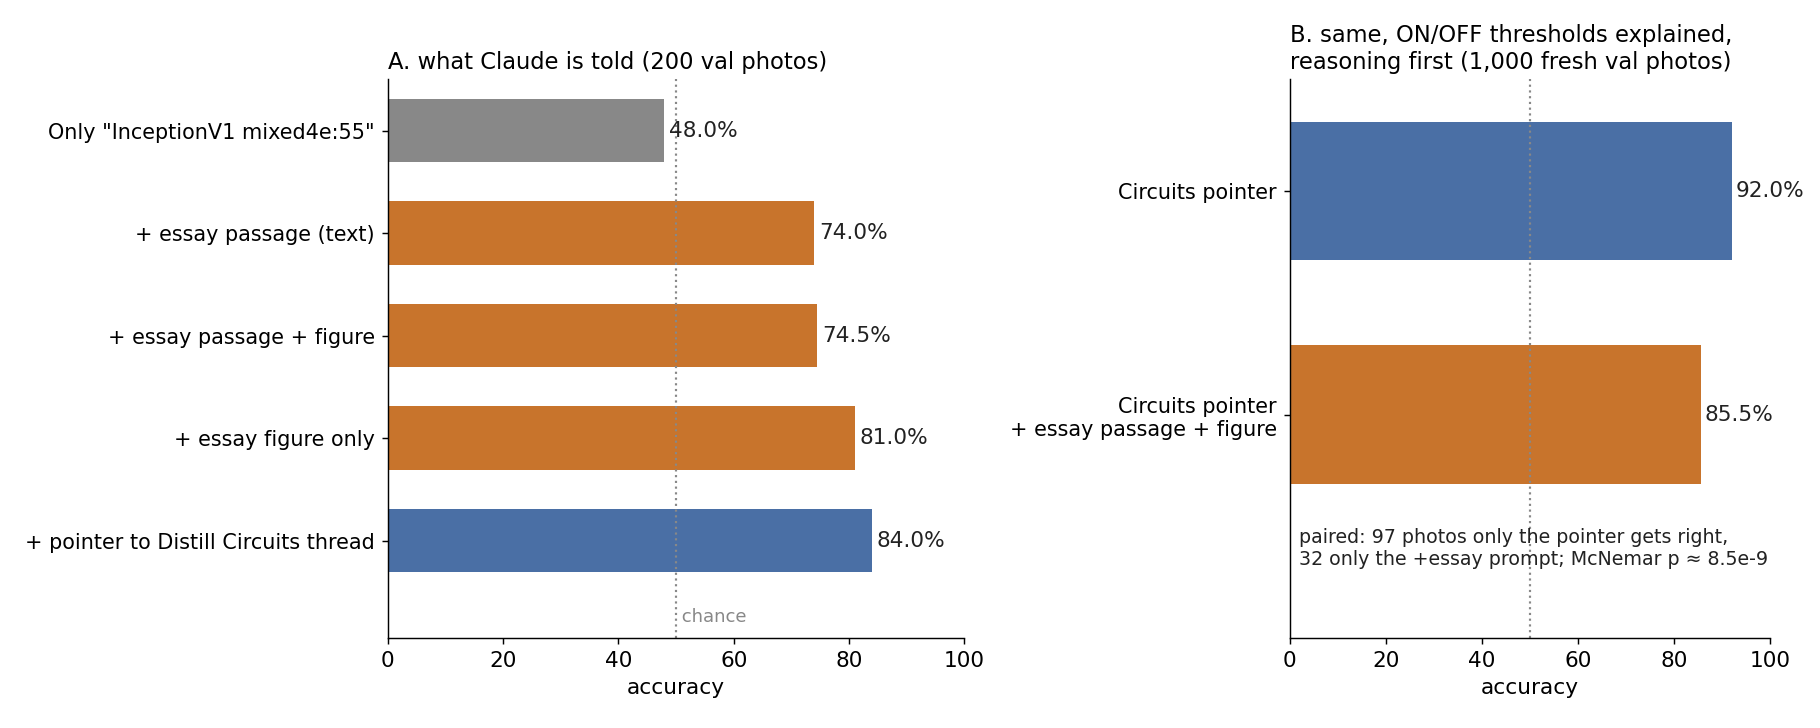
Five prompts on the 200 val photos
| What Claude was given | Accuracy | AUC |
|---|---|---|
| Only the neuron's identity (“channel 55 of mixed4e of InceptionV1 … use whatever you know”) | 48.0% | 0.51 |
| The essay's 4e:55 paragraphs | 74.0% | 0.85 |
| The essay's 4e:55 paragraphs + screenshot of its figure | 74.5% | 0.85 |
| Screenshot of the essay's figure only | 81.0% | 0.88 |
| Identity + “this is the neuron discussed in Distill's Circuits thread … a well-known polysemantic neuron” | 84.0% | 0.96 |
The head-to-head on 1,000 fresh photos
Two prompts, identical except that B adds the essay. Both explain the exact ON/OFF cutoffs and ask for 2–4 sentences of reasoning before the probability. One user message per photo, no system prompt.
A (Circuits pointer):
You are predicting a single neuron: channel 55 of layer mixed4e ("4e:55") of InceptionV1 (GoogLeNet), the convolutional network trained on
ImageNet-1k classification; specifically the original model released with TensorFlow/Lucid. The neuron's value on an image is its strongest
response anywhere in the image, measured as a fraction of the neuron's maximum over all ~1.33M ImageNet images. ON means that value is at least
30% of the maximum; OFF means it is below 5%. Images in between are never shown. About half of the images you will see are ON. Use whatever you
know about this network and this neuron. This is the neuron discussed in Distill's Circuits thread (the Feature Visualization and Zoom In
articles), where it was presented as a well-known polysemantic neuron.

Here is a new photo:
[photo]
In 2-4 sentences, say what in the photo matters for this neuron and why. Then on the last line write only the probability (0-100) that the neuron is ON.
B (Circuits pointer + essay): the same, with this inserted before “Here is a new photo:”
New research from Nick Cammarata (the essay "Neural networks are already clean", Goodfire), on this neuron, verbatim:

[the essay's paragraphs on 4e:55, verbatim, with citation pop-ups removed]

The essay's figure for this neuron (its caption: "[the figure's caption]"):
[screenshot of the essay's 4e:55 figure: inputs, readers, renders and the pointed/round photo panel]
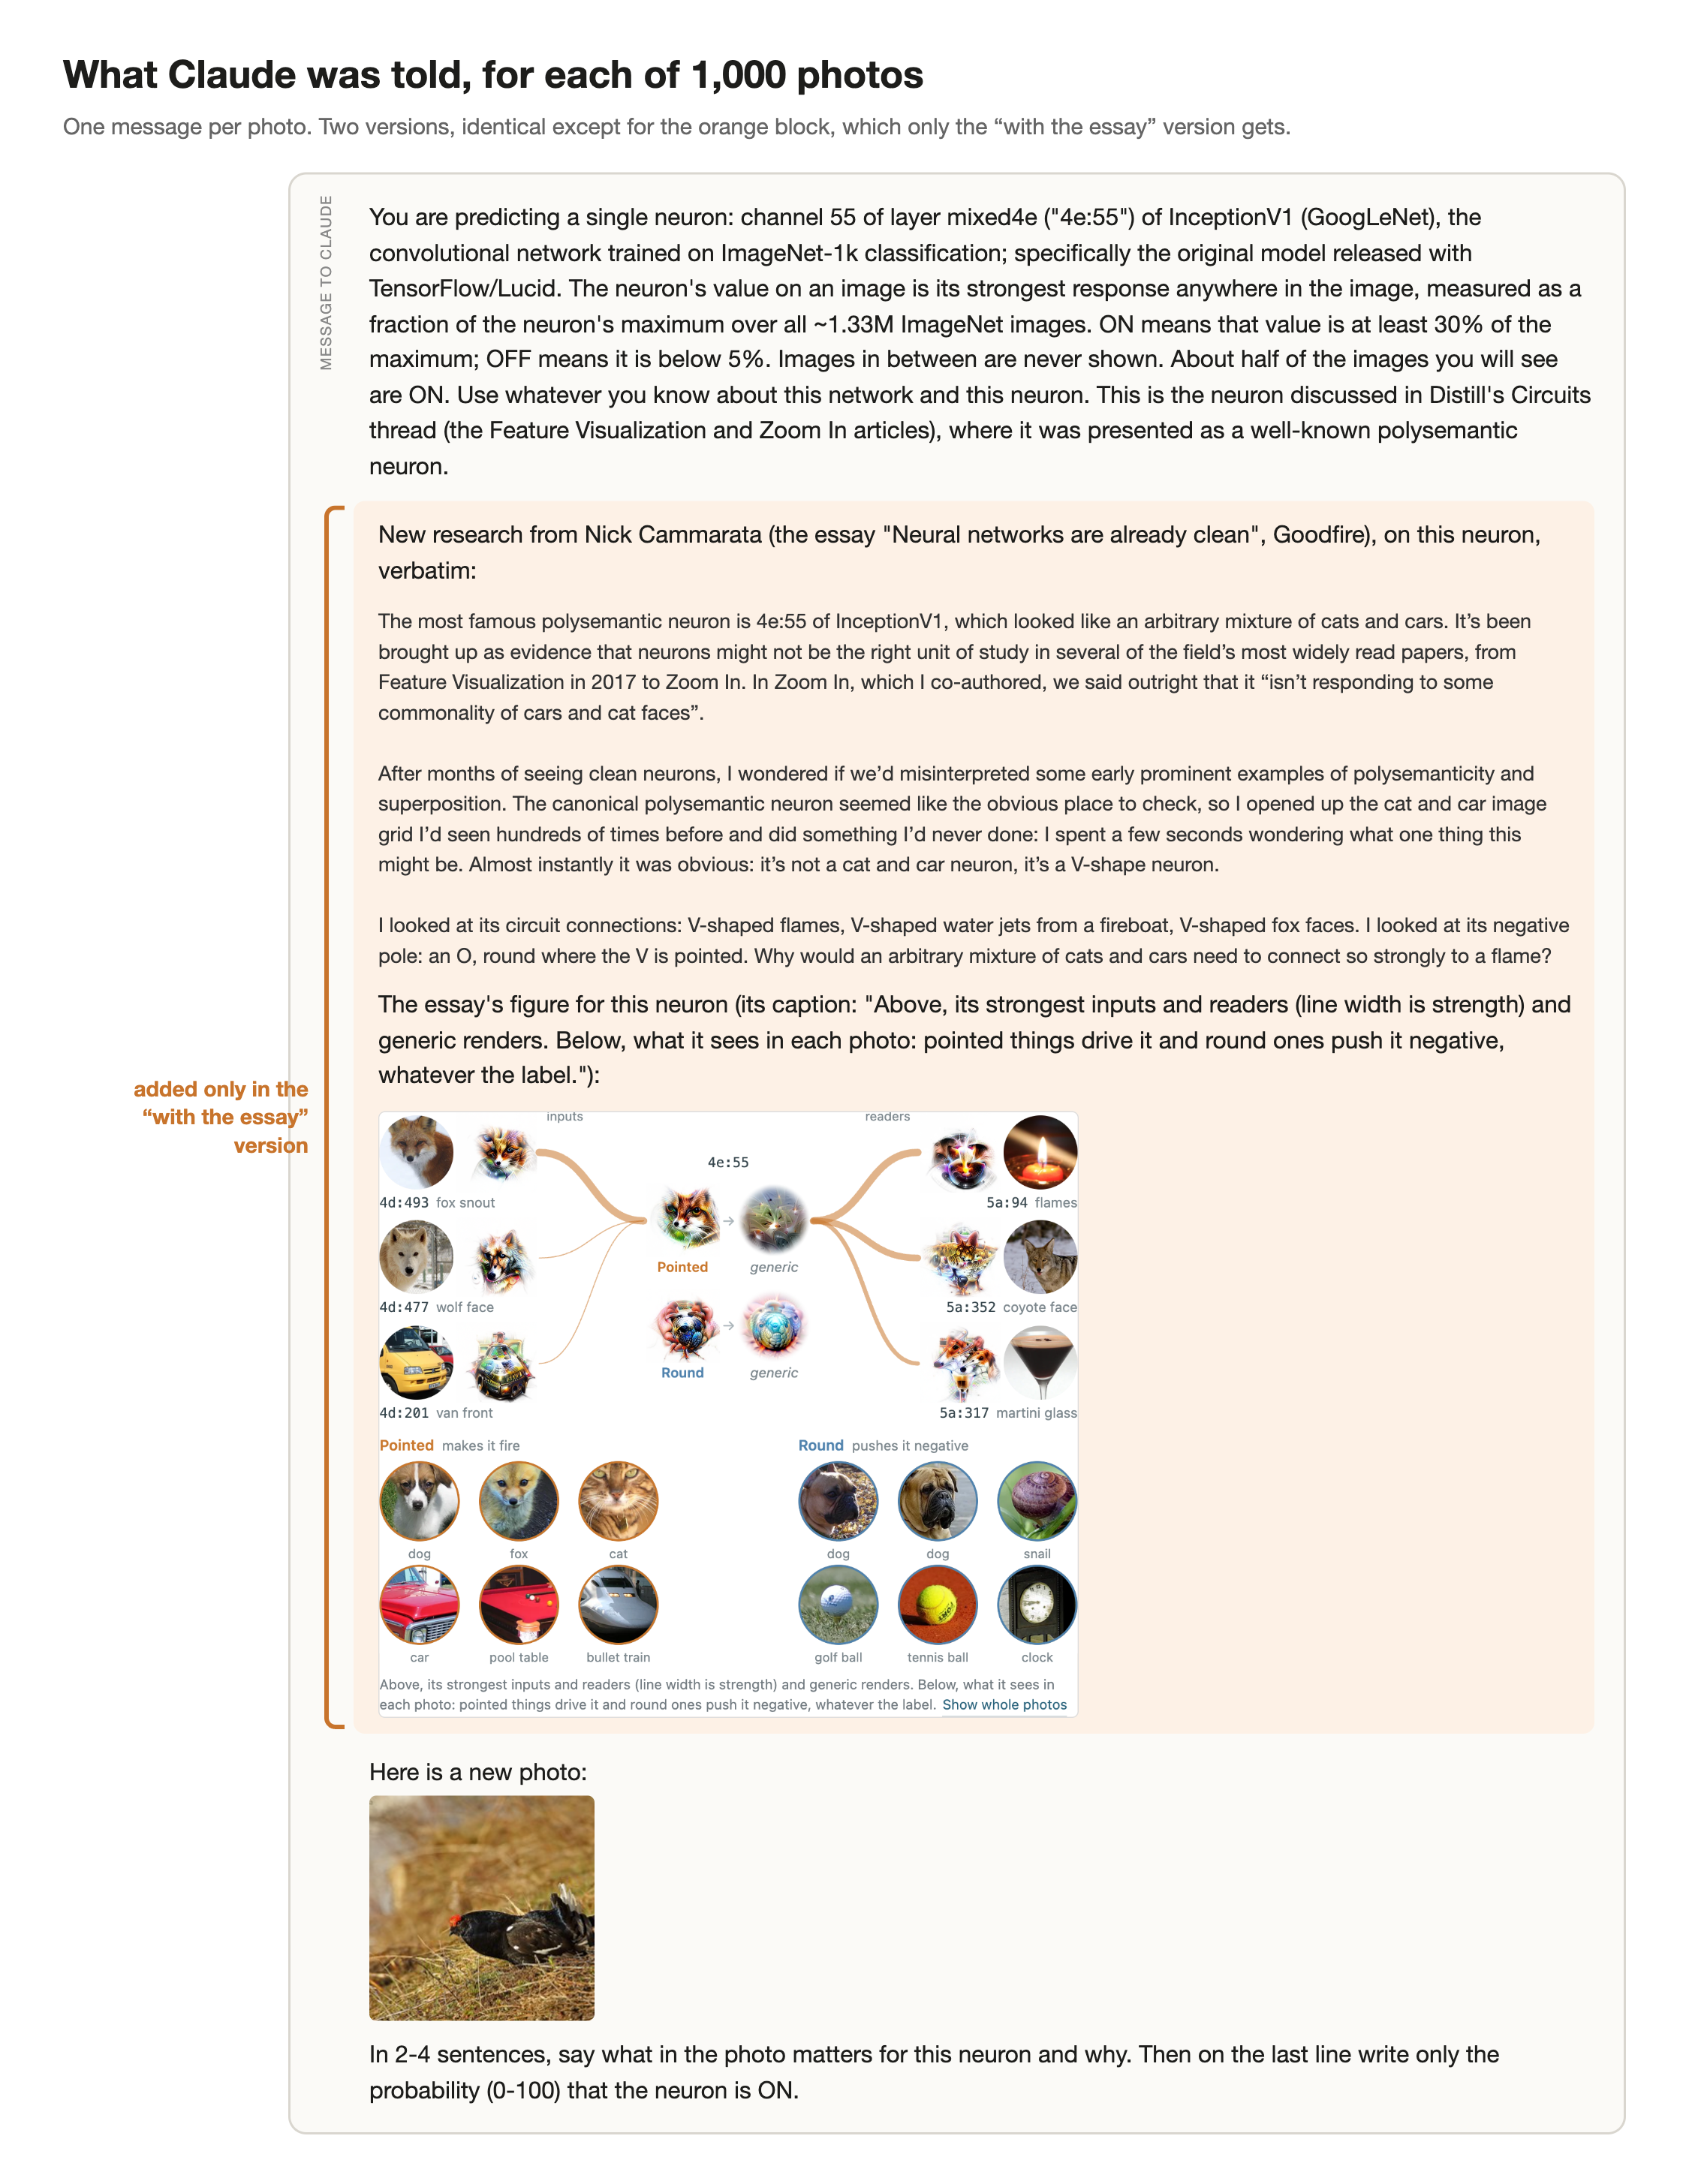
C (control): identical to B, including the “New research from Nick Cammarata…” line, but the essay's three paragraphs and the figure caption are replaced by lorem ipsum of the same character lengths, and the figure screenshot by a pure white PNG of the same pixel size.
All three: Claude Opus 5.5 (claude-opus-5-5), effort low, max_tokens 4000, one user message per photo,
no system prompt. The probability is the last number on the last line of the reply; at least 50 counts as “fires”.
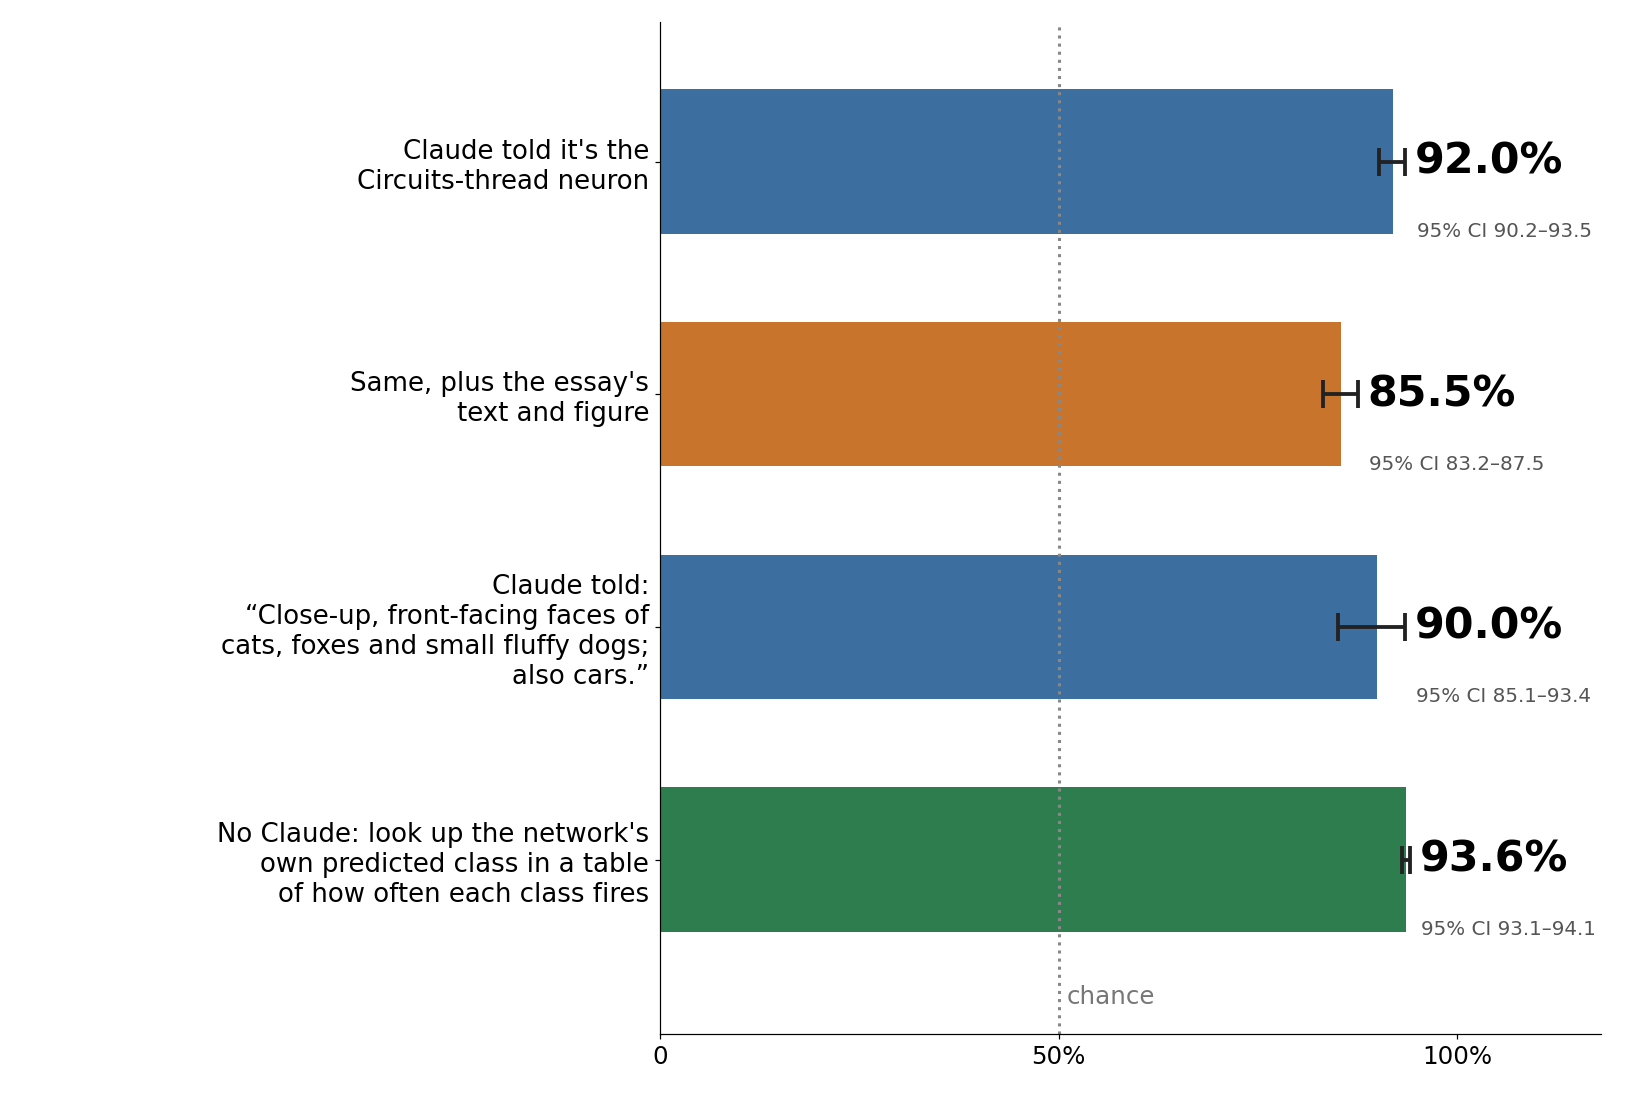
| Photos | A: Circuits pointer | C: + lorem ipsum | B: + essay |
|---|---|---|---|
| 200 val | 90.5% | — | 85.5% |
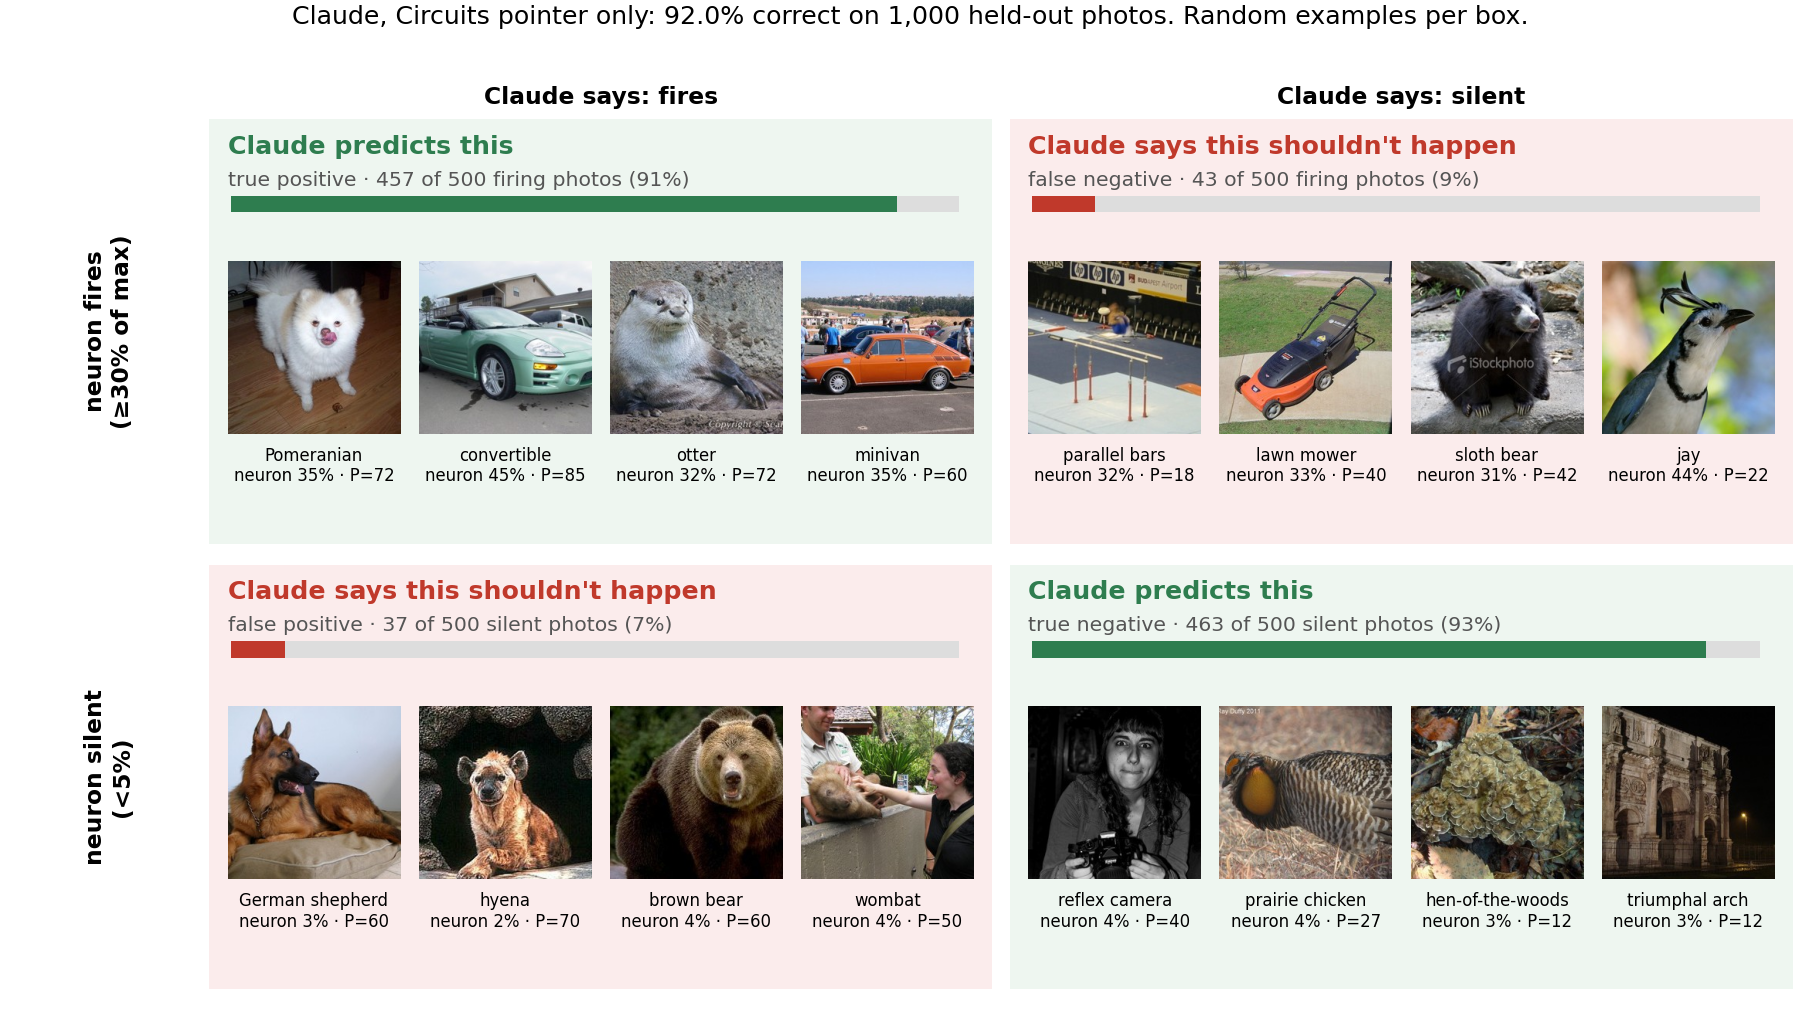
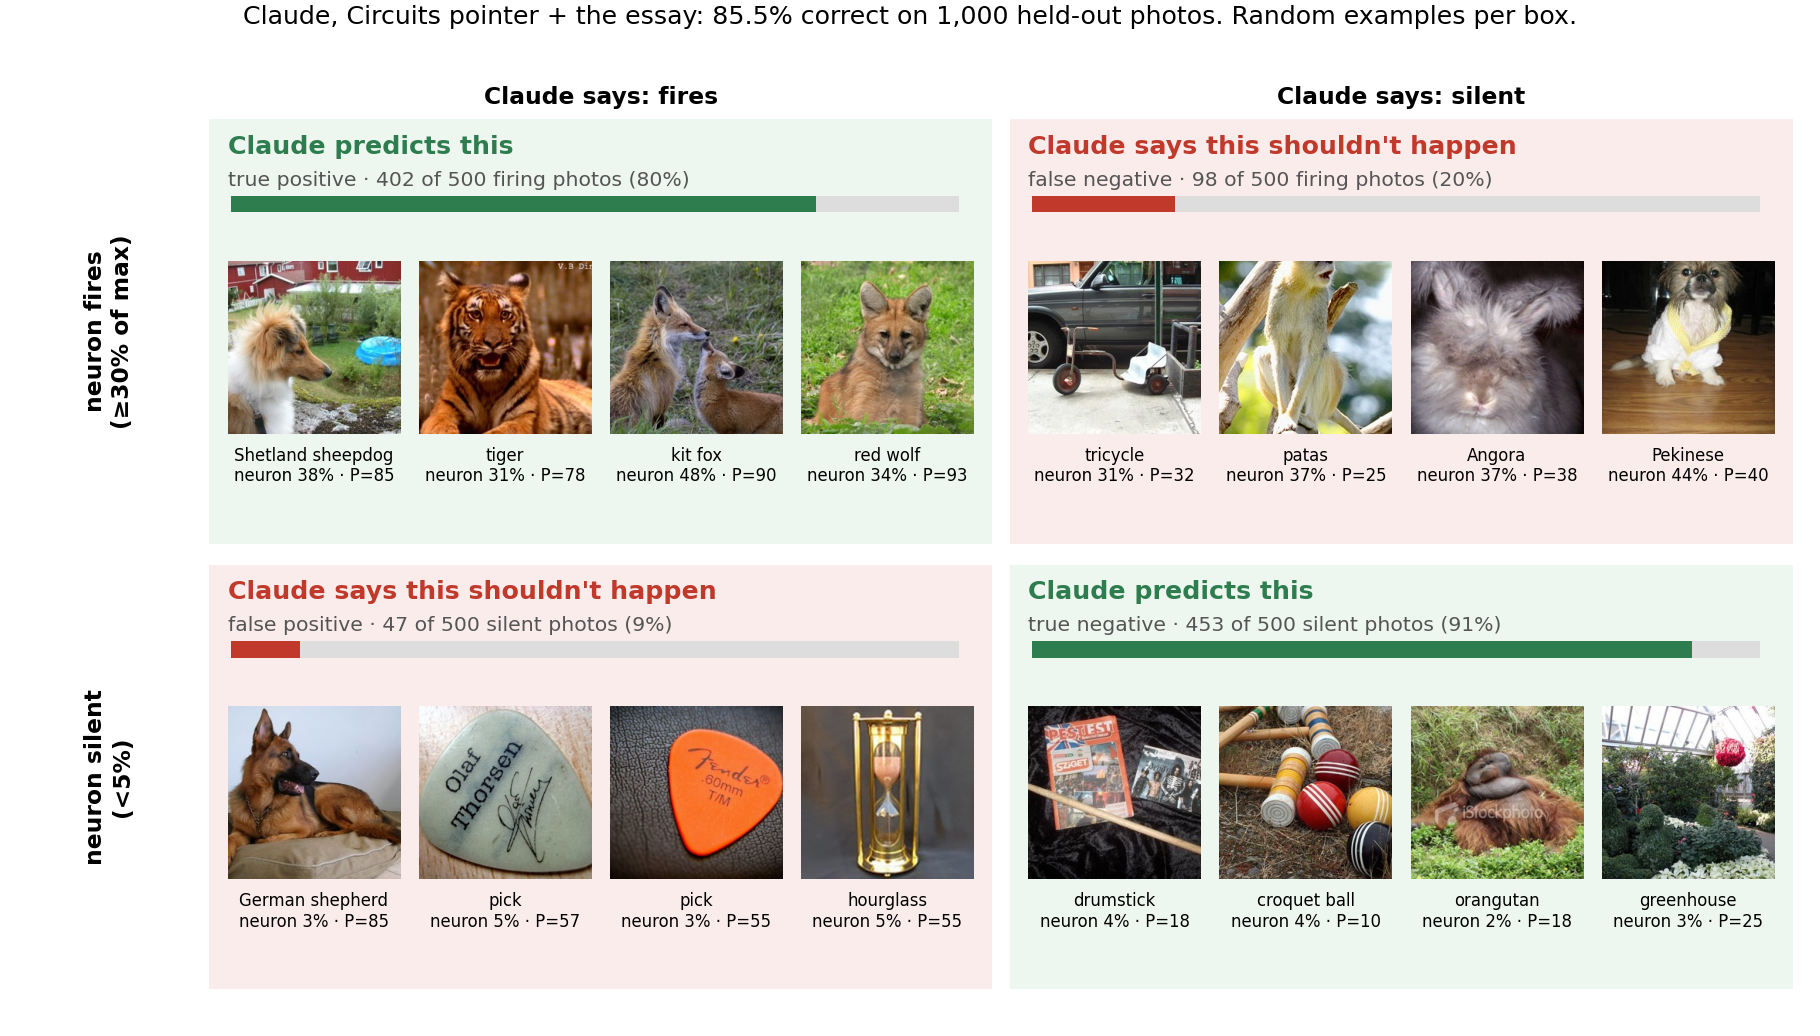
| 1,000 val2 (500 fire, 500 silent) | 92.0% (90.2–93.5) | 90.2% | 85.5% (83.2–87.5) |
Paired tests on the same 1,000 photos (exact McNemar: a two-sided binomial test on the photos where exactly one prompt is right):
- A vs B: 97 photos only A gets right, 32 only B; p ≈ 8.5×10⁻⁹.
- A vs C: 41 vs 23; p = 0.033. A long irrelevant block costs about 2 points.
- C vs B: 99 vs 52; p = 0.00016. The essay's content costs about 5 points on top of that.
Intervals in parentheses are 95% Wilson intervals on each accuracy alone; for comparing prompts on the same photos, the paired tests are the right ones.
What changes in Claude's reasoning
Shape words (regex \b(point|pointed|pointy|round|rounded|V-shape|V shape|wedge|angular), case-insensitive) appear in 100% of B's
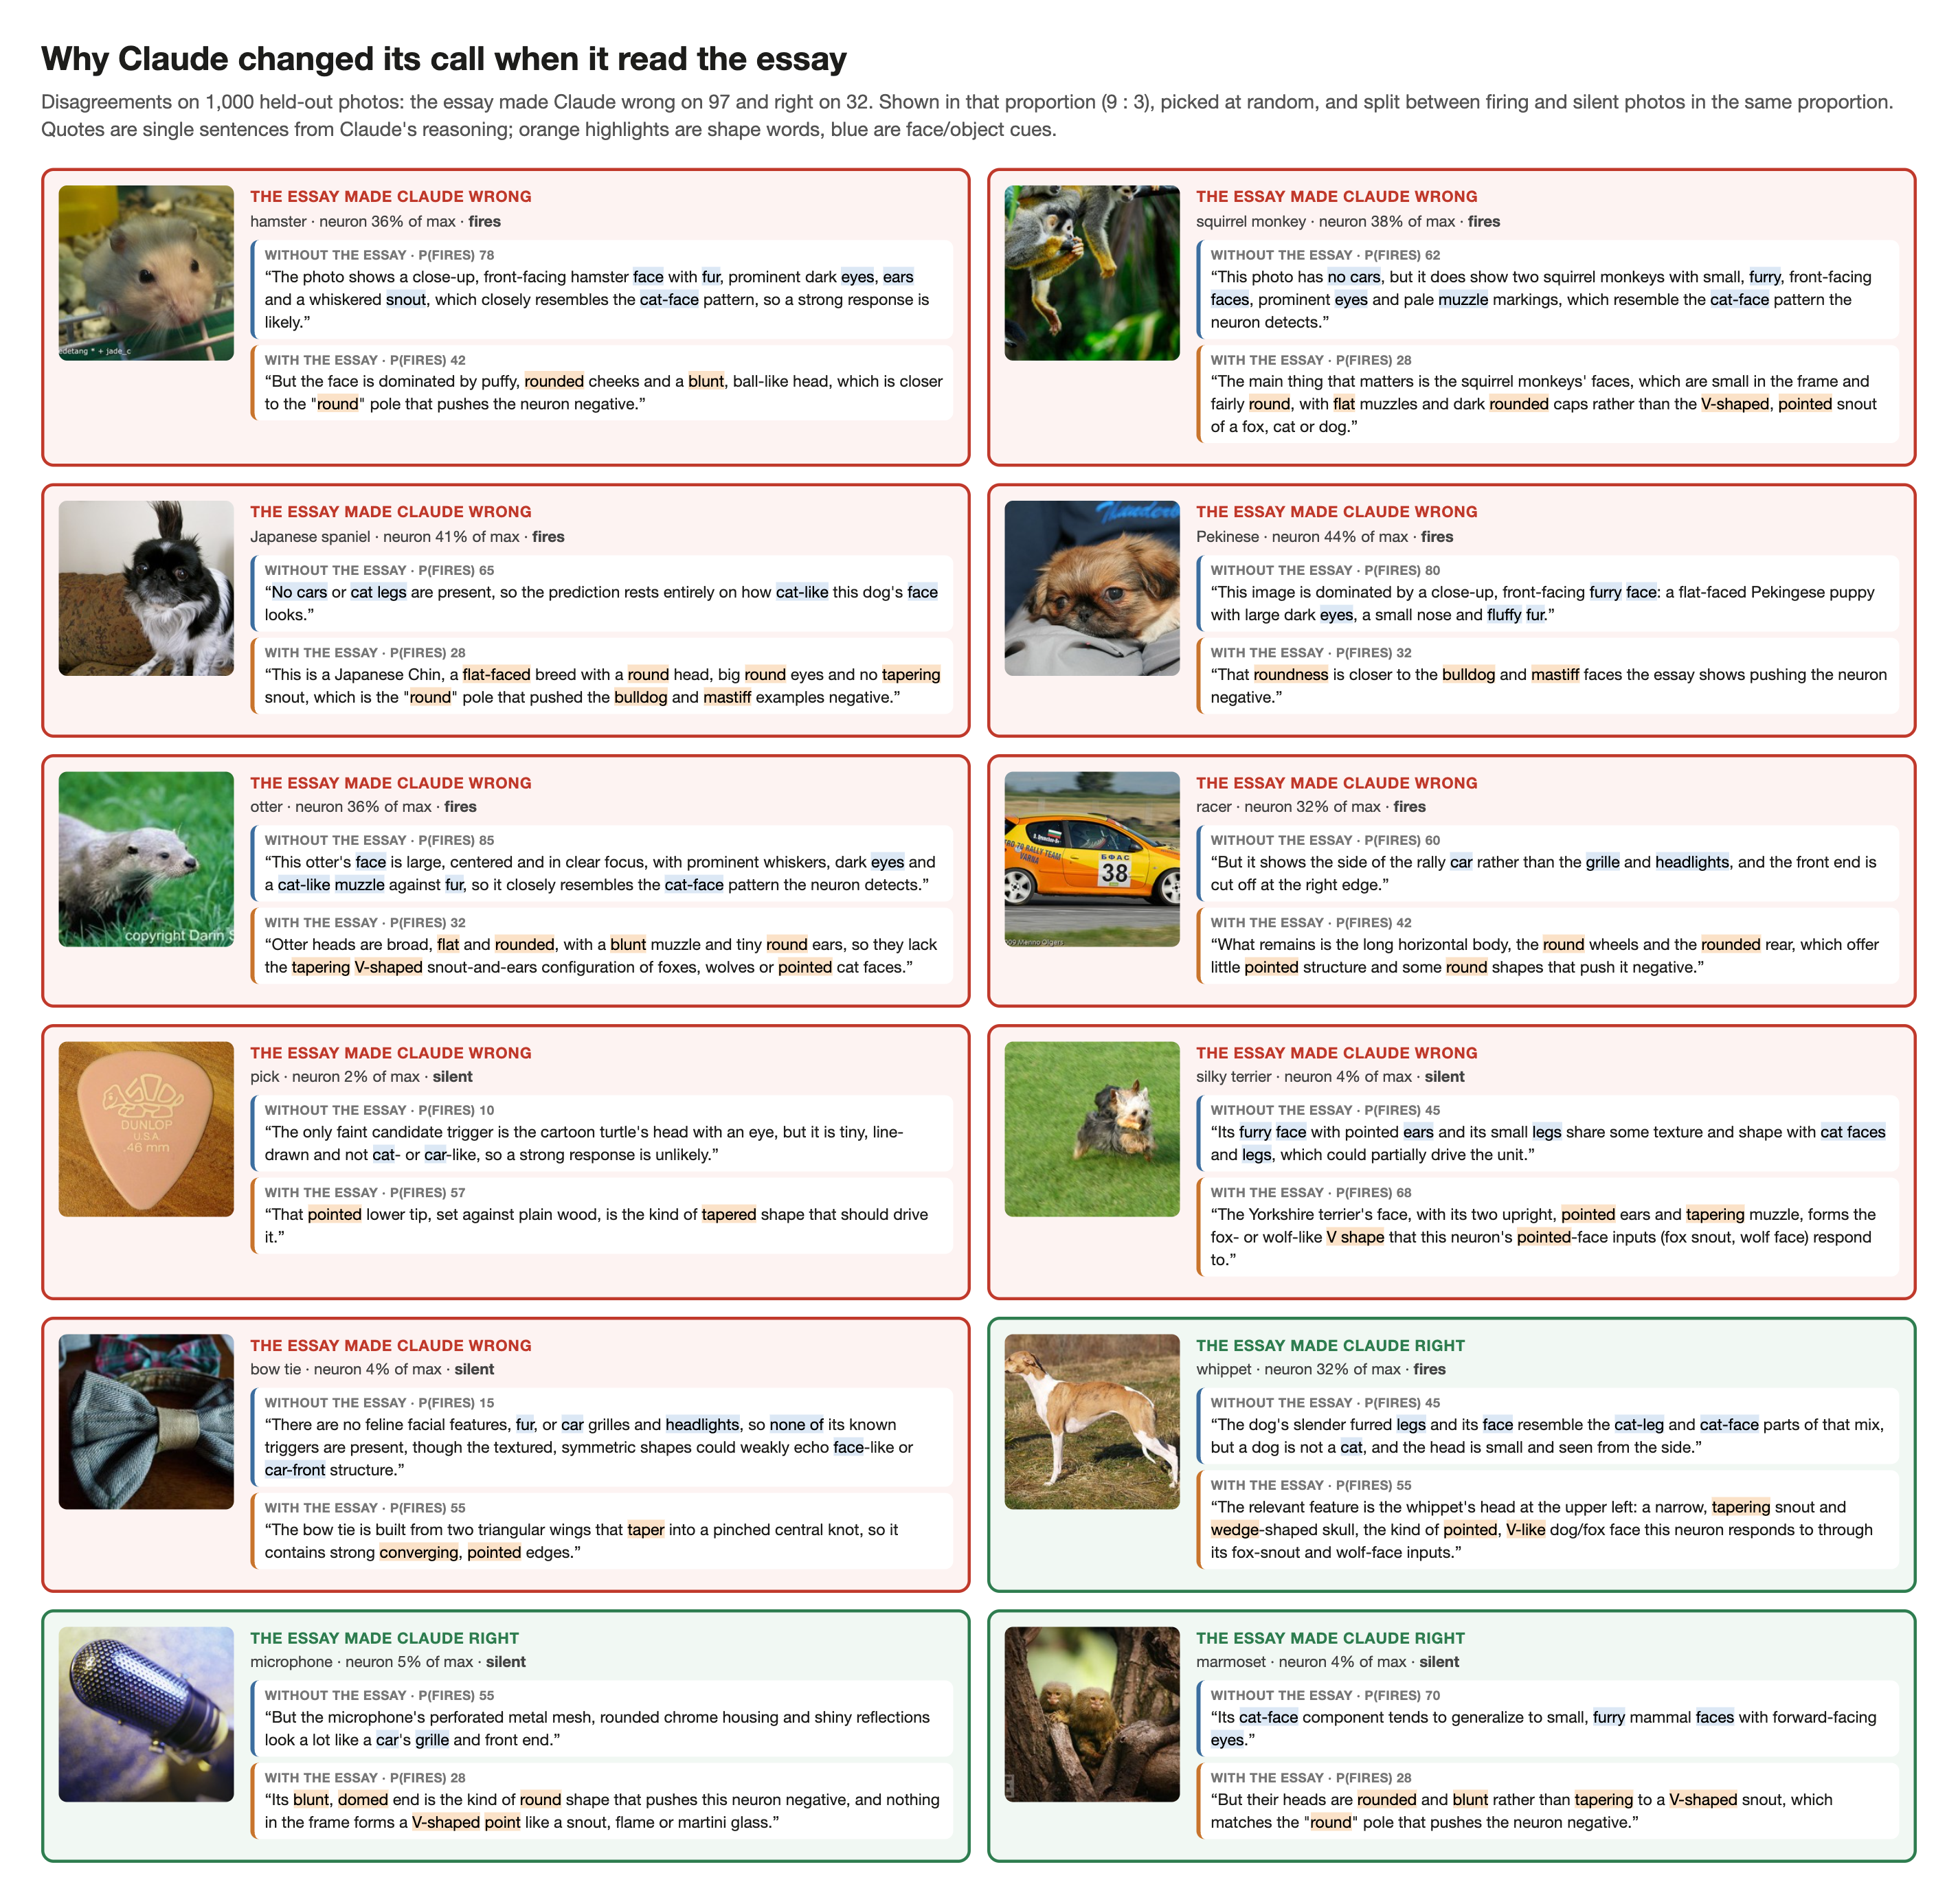
replies and 38% of A's. The two prompts disagree on 129 photos: on 97 the essay makes Claude wrong (68 of them firing photos it now calls silent,
mostly round, flat-faced animals such as hamsters, Pekinese, Persian cats and otters), and on 32 it makes Claude right.
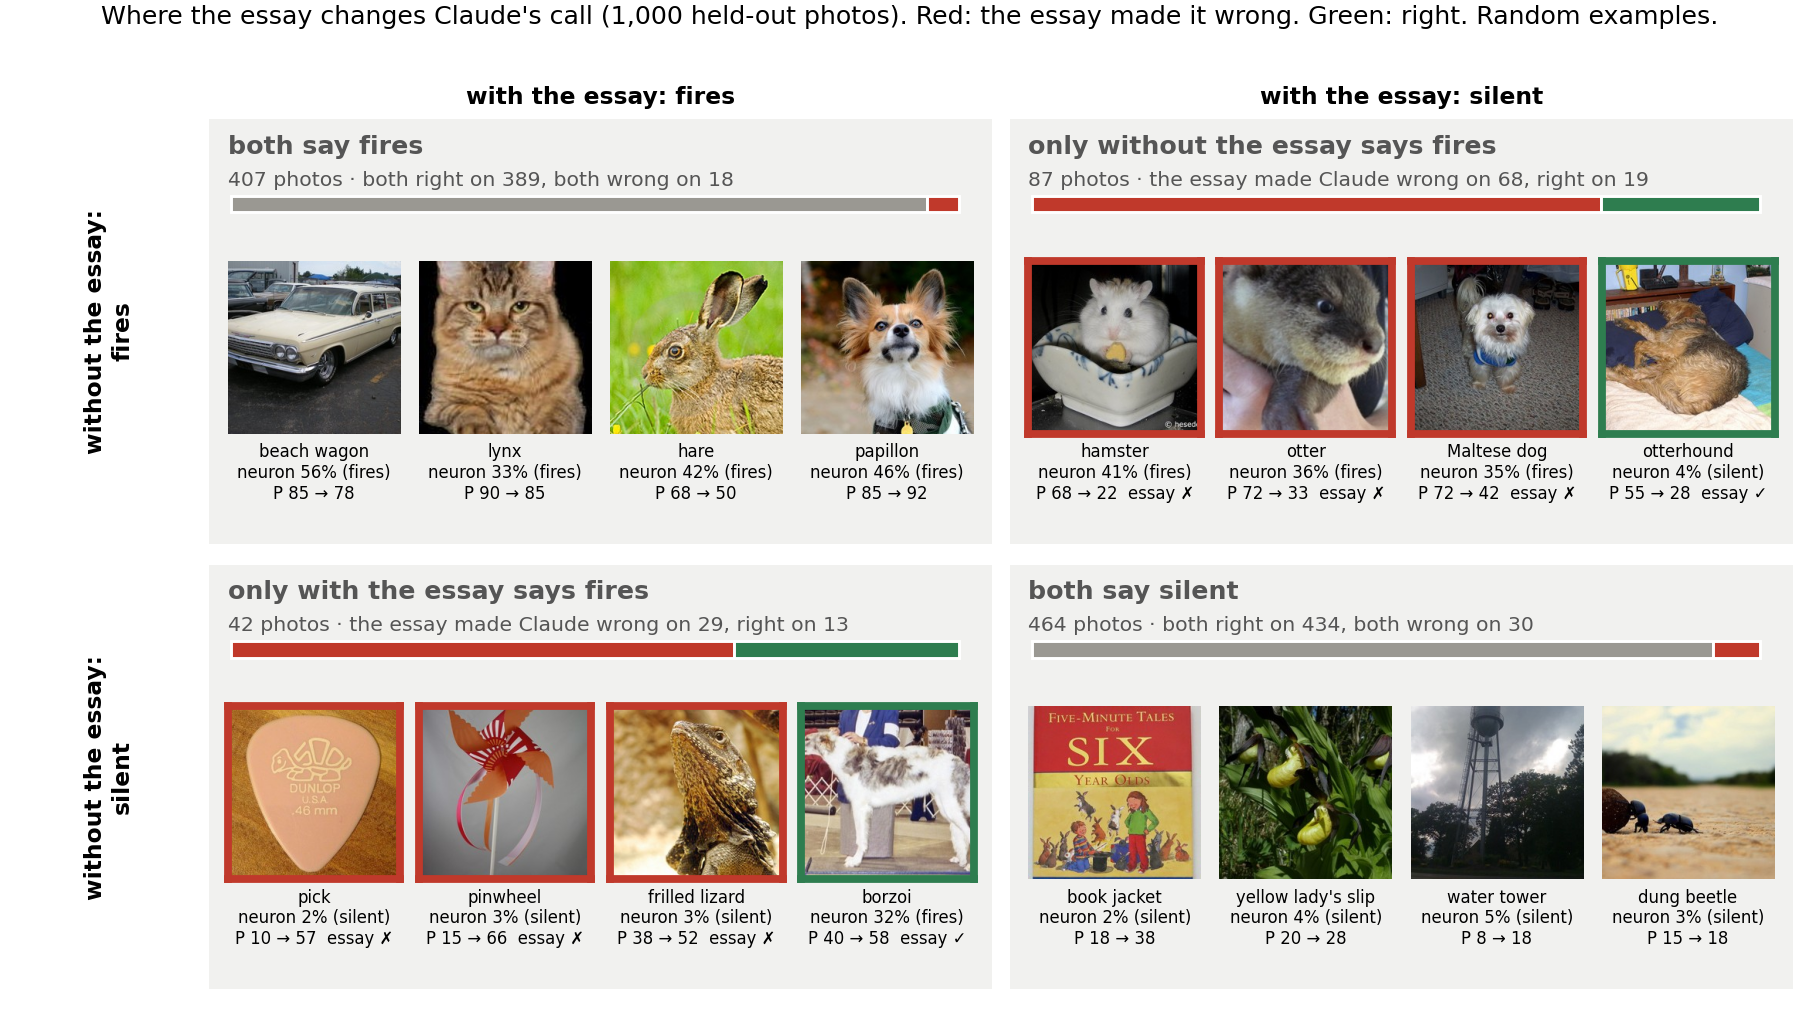
Same grid with the biggest changes as examples
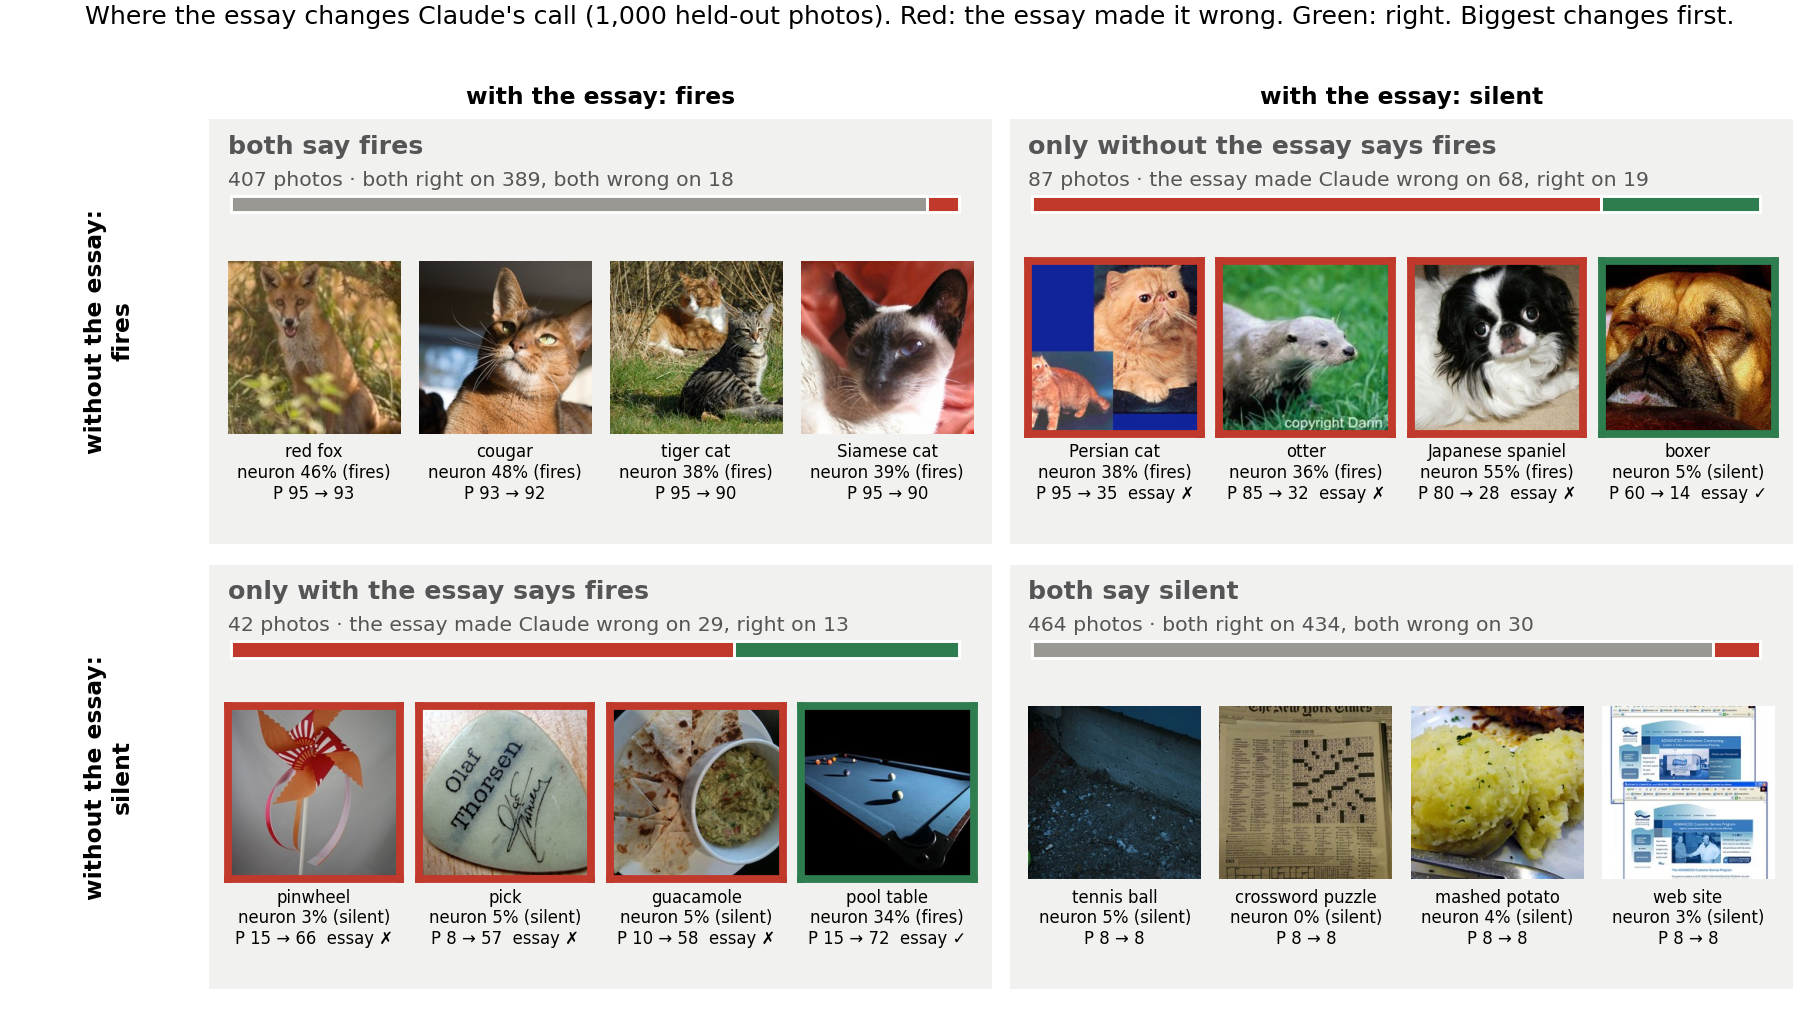
A and B each against the truth (random examples)
All of Claude's replies, per photo and per prompt (A, B and C), are in reasoning_val2_1000.jsonl and reasoning_val200.jsonl. This used one judge model; we have not repeated it with another.
6. Baselines without Claude: class lookups
A table of how often each ImageNet class fires, fit on training photos and applied to validation photos. Balanced accuracy equals accuracy on a 50/50 set.
| Predictor | ≥30% vs <5% (thread) | ≥30% vs <30% | top 10% vs bottom 10% |
|---|---|---|---|
| True ImageNet label → table | 92.5% | 88.3% | 86.5% |
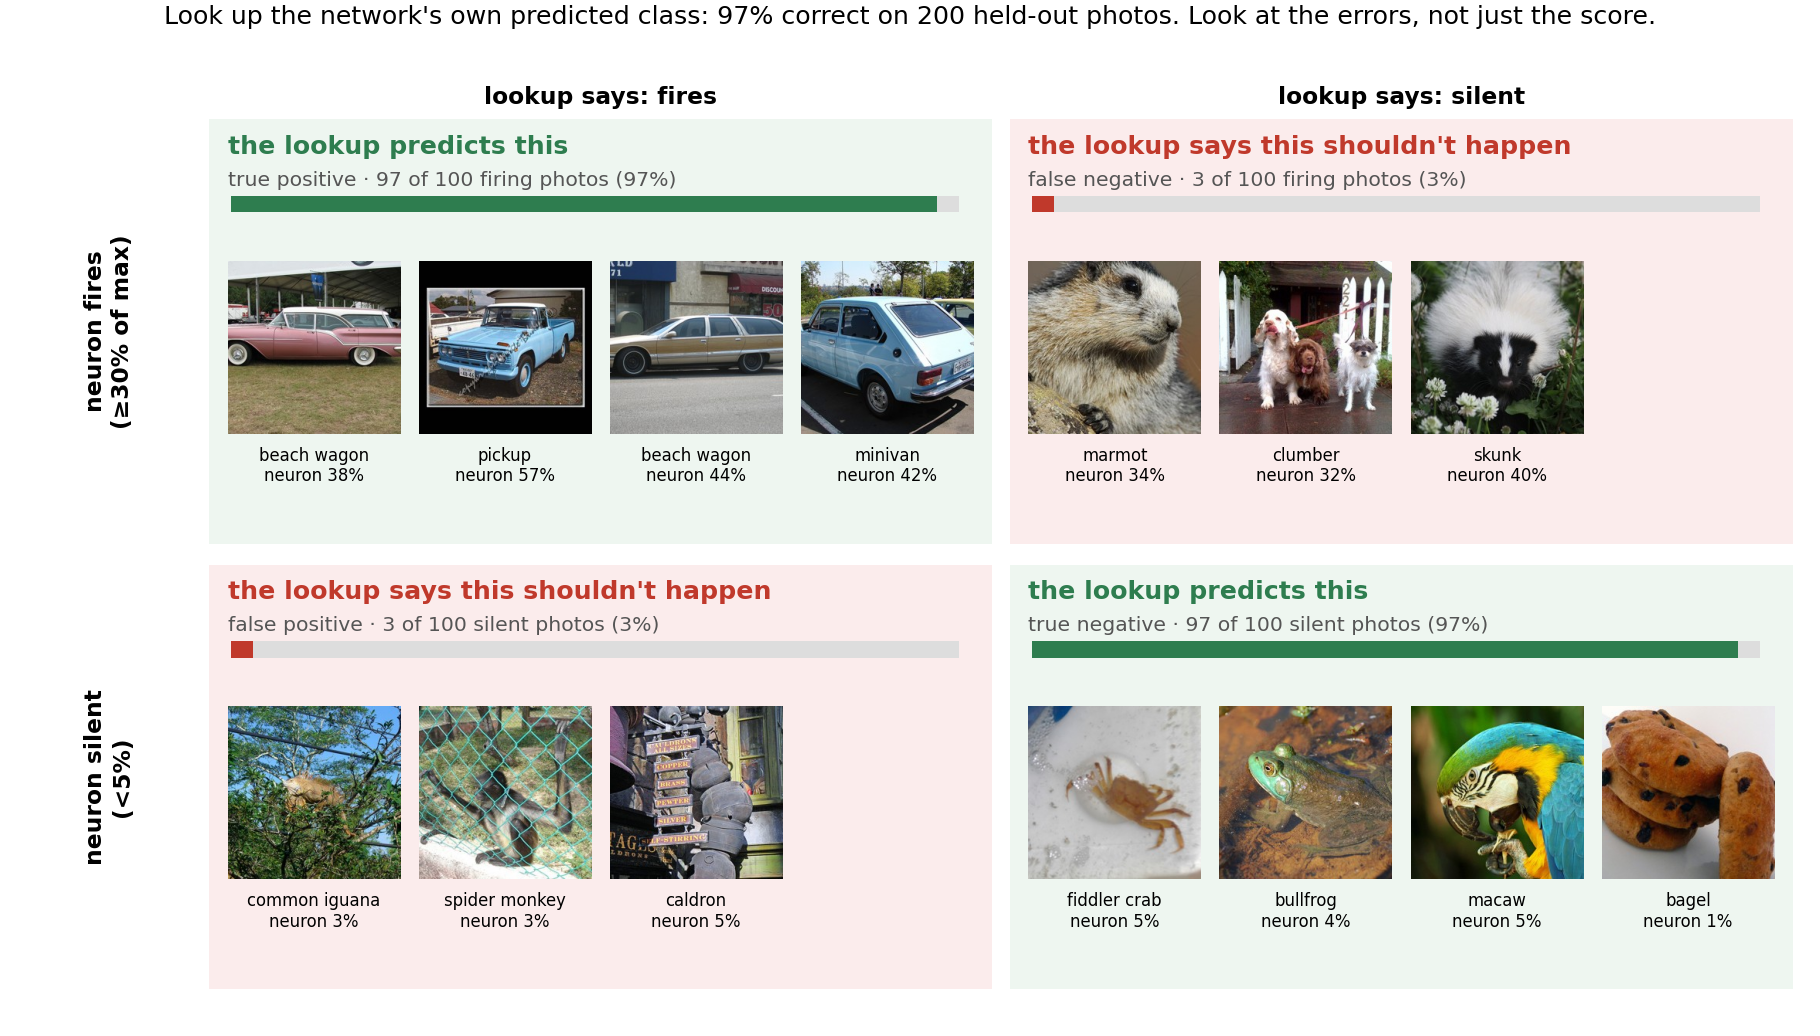
| Network's own top-1 prediction → table | 93.6% | 88.9% | 87.6% |
| Logistic regression on the network's 1000 output probabilities | 93.8% | 89.4% | 88.0% |
| Logistic regression on the 1000 logits* | 97.7% | 93.4% | 94.7% |
| Val photos used | 9,561 | 50,000 | 10,065 |
*The logits are computed downstream of 4e:55, so this partly reads the neuron back. Treat it as an upper bound, not a baseline. Split by whether the network's top-1 is correct, the true-label table gets 94.1% where it is right and 87.7% where it is wrong; the predicted-class table gets 92.0% even where the network is wrong. Raw numbers: 30/5, 30 vs rest, p90/p10.
7. Other experiments
Run along the way; kept for completeness. Most use the same cutoffs and judge as above.
7.1 Pointed vs round with real proportions
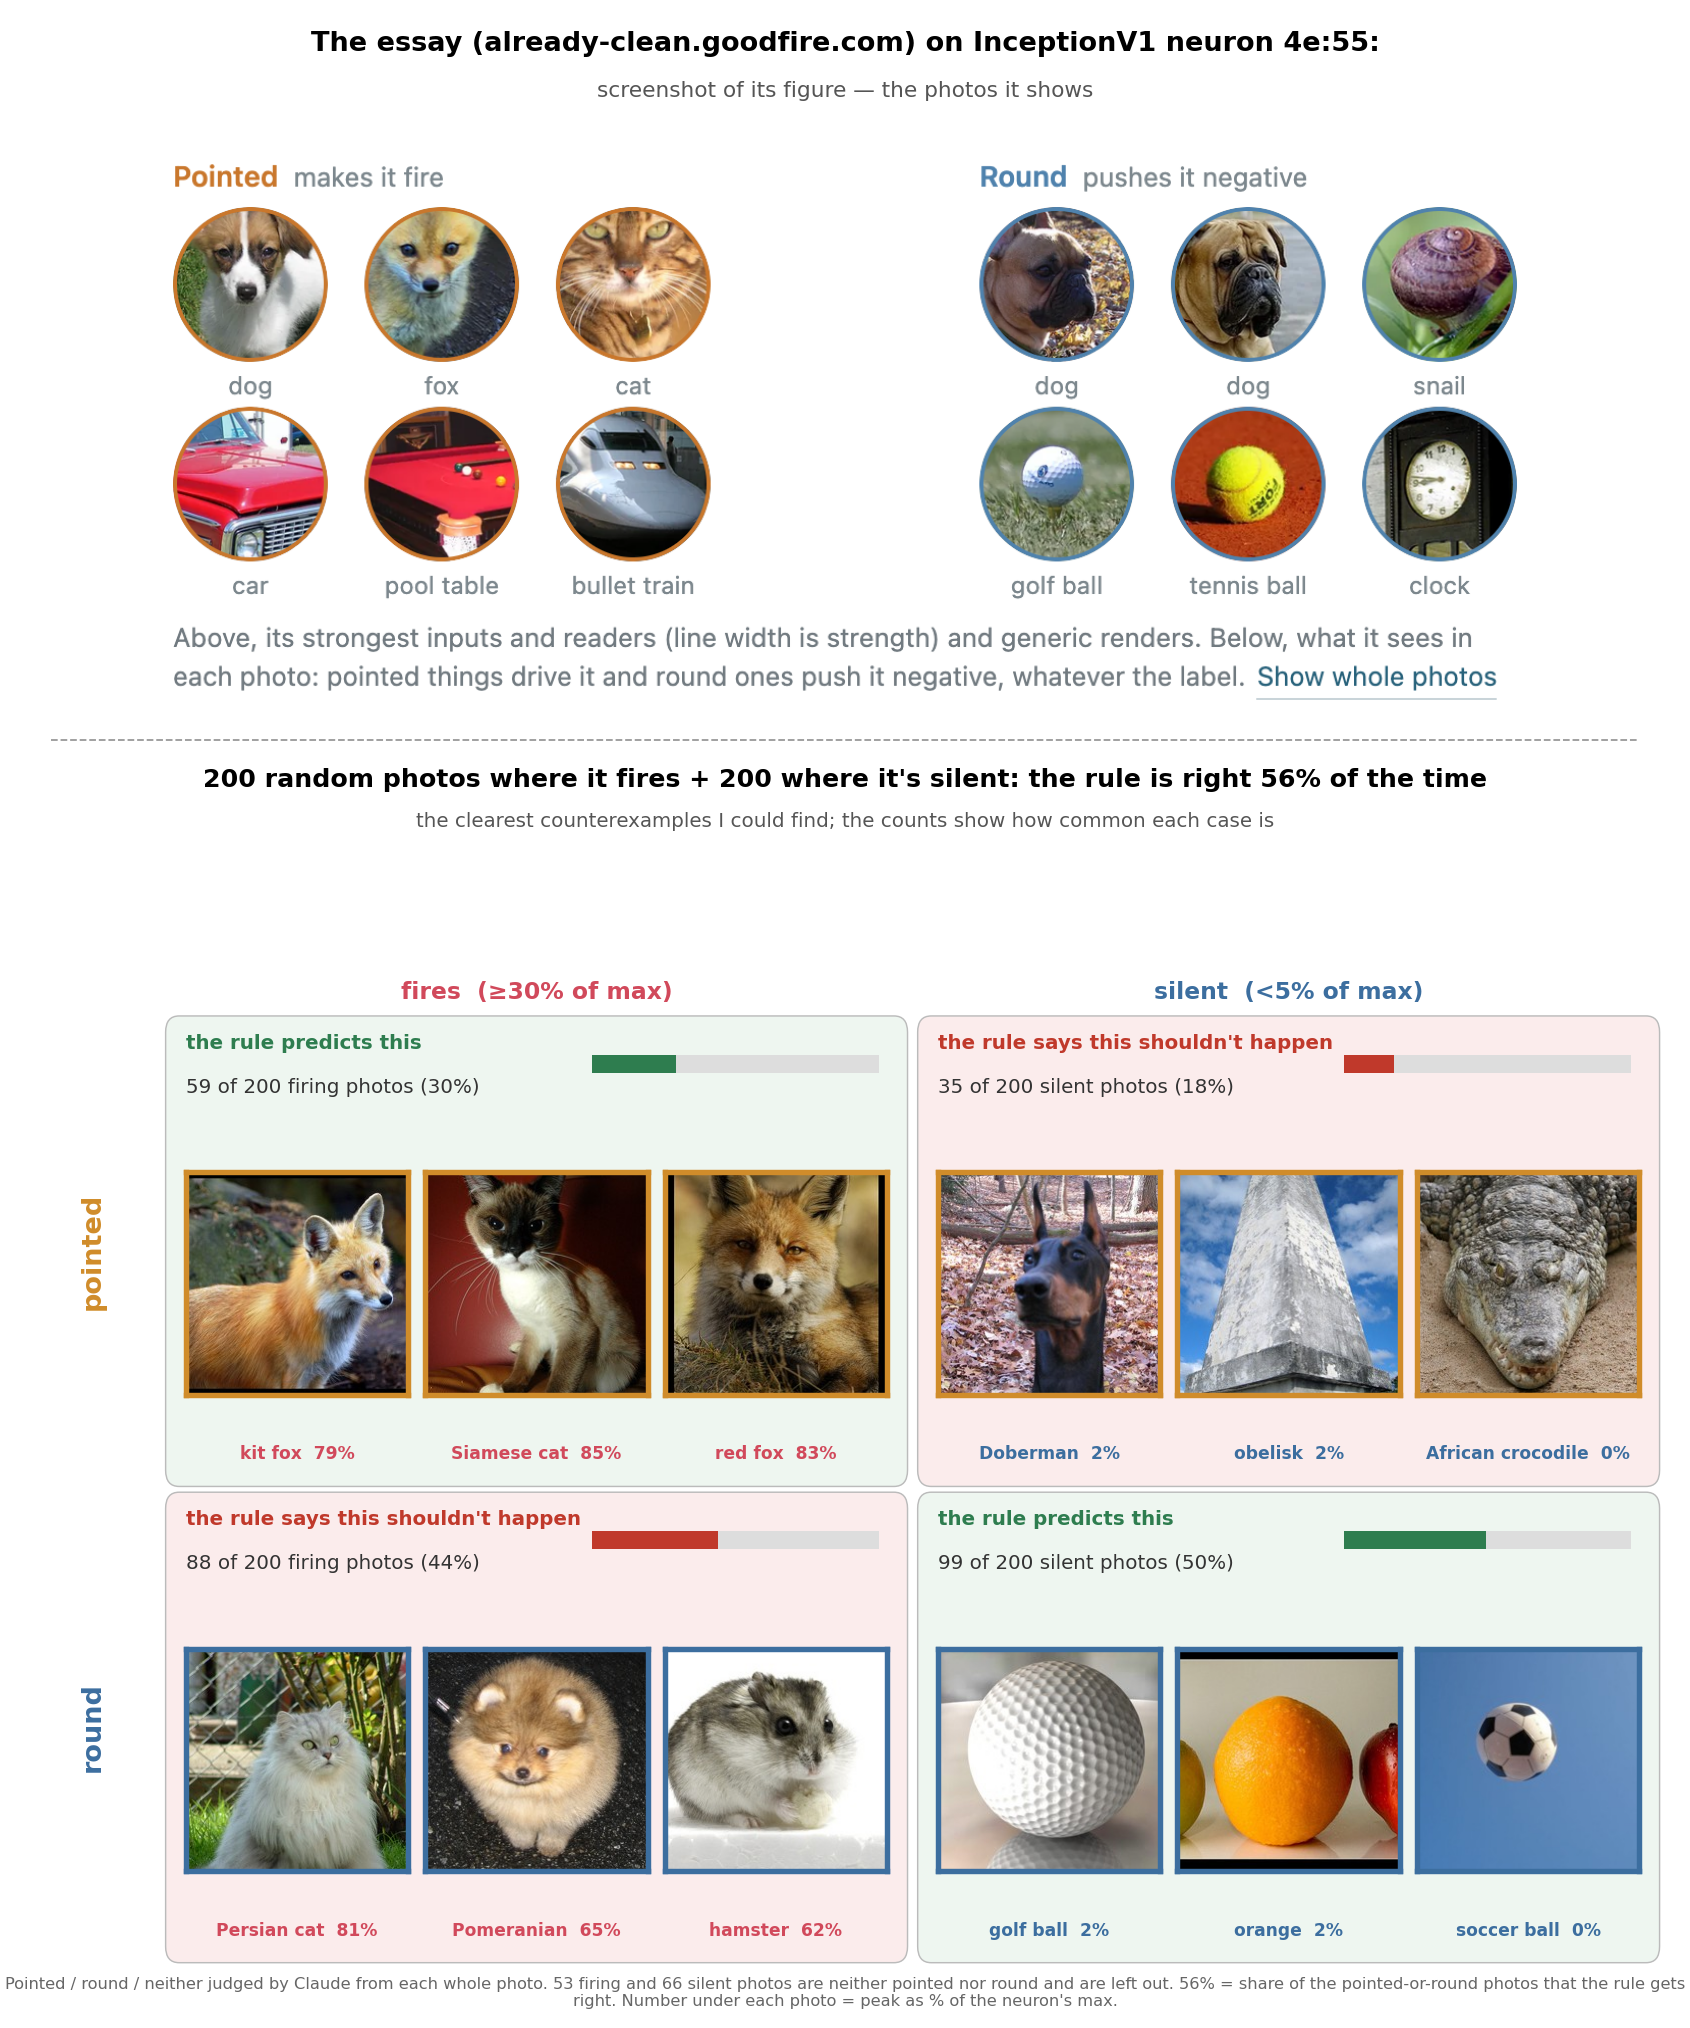
400 random training photos (200 firing, 200 silent). Claude labelled each photo's main subject pointed, round or neither. Firing: 59 pointed, 88 round, 53 neither. Silent: 35 pointed, 99 round, 66 neither. Of the 281 pointed-or-round photos, “pointed fires, round doesn't” is right on 158 (56%).
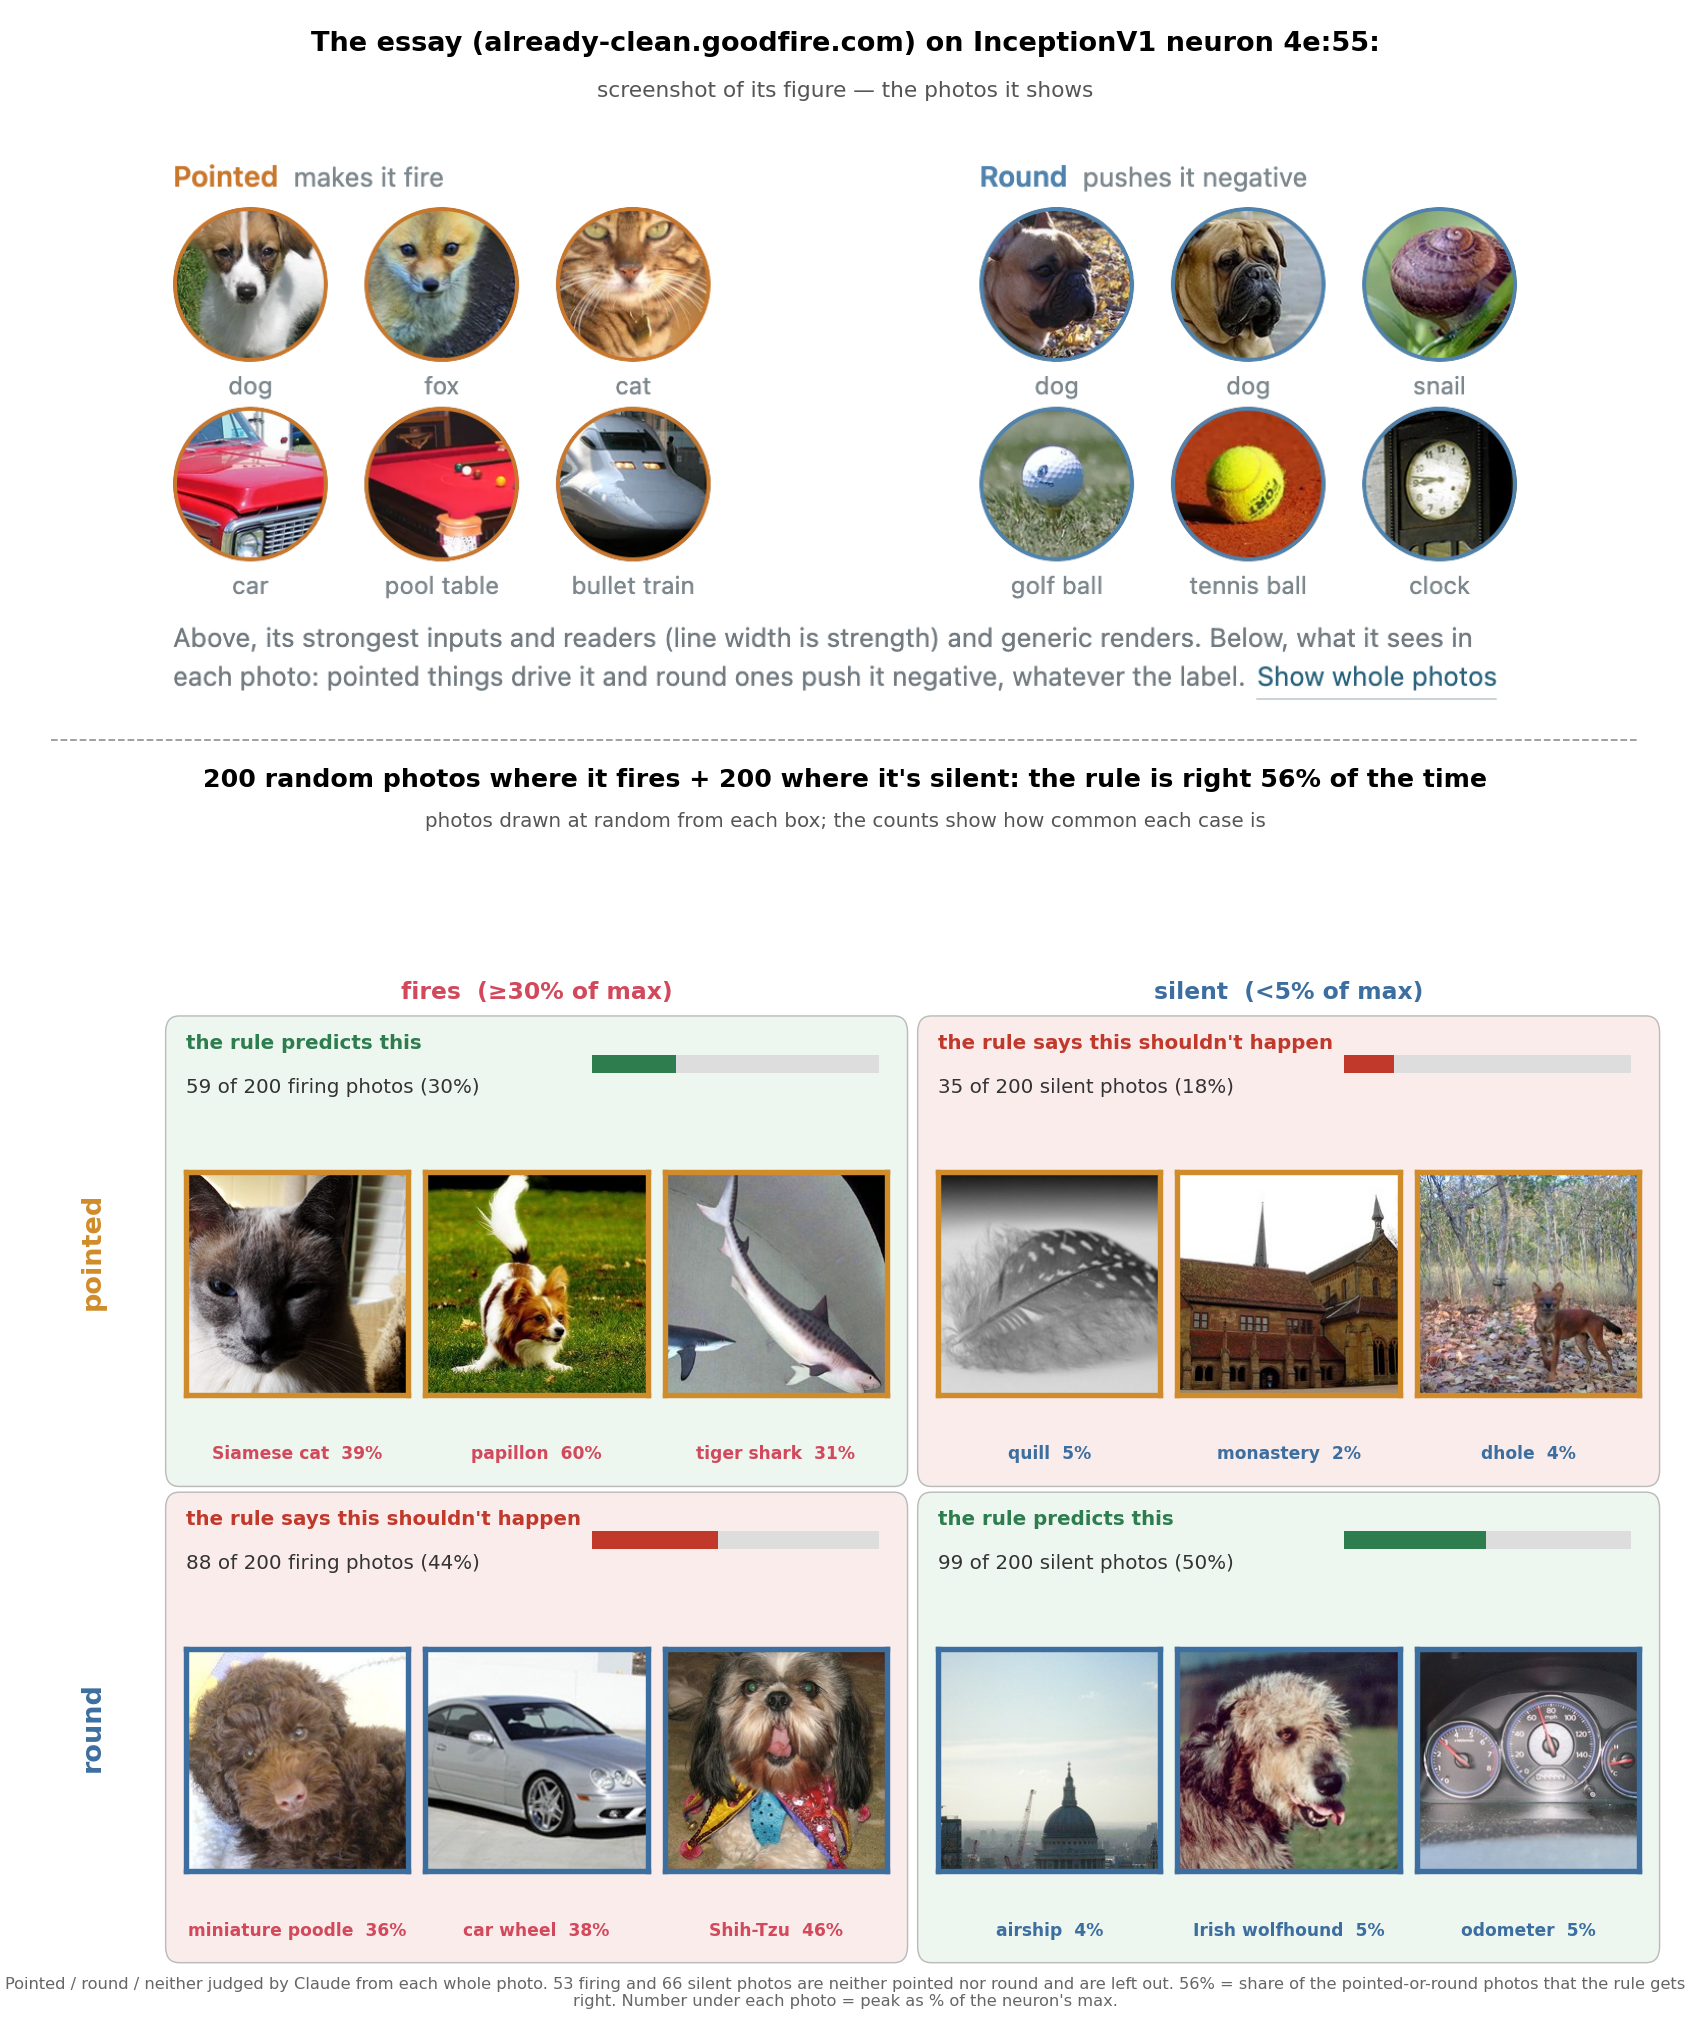
The worst counterexamples, same counts
7.2 What it responds to at each level
7.3 A searched non-noun feature: “sleek sheen + an eye”
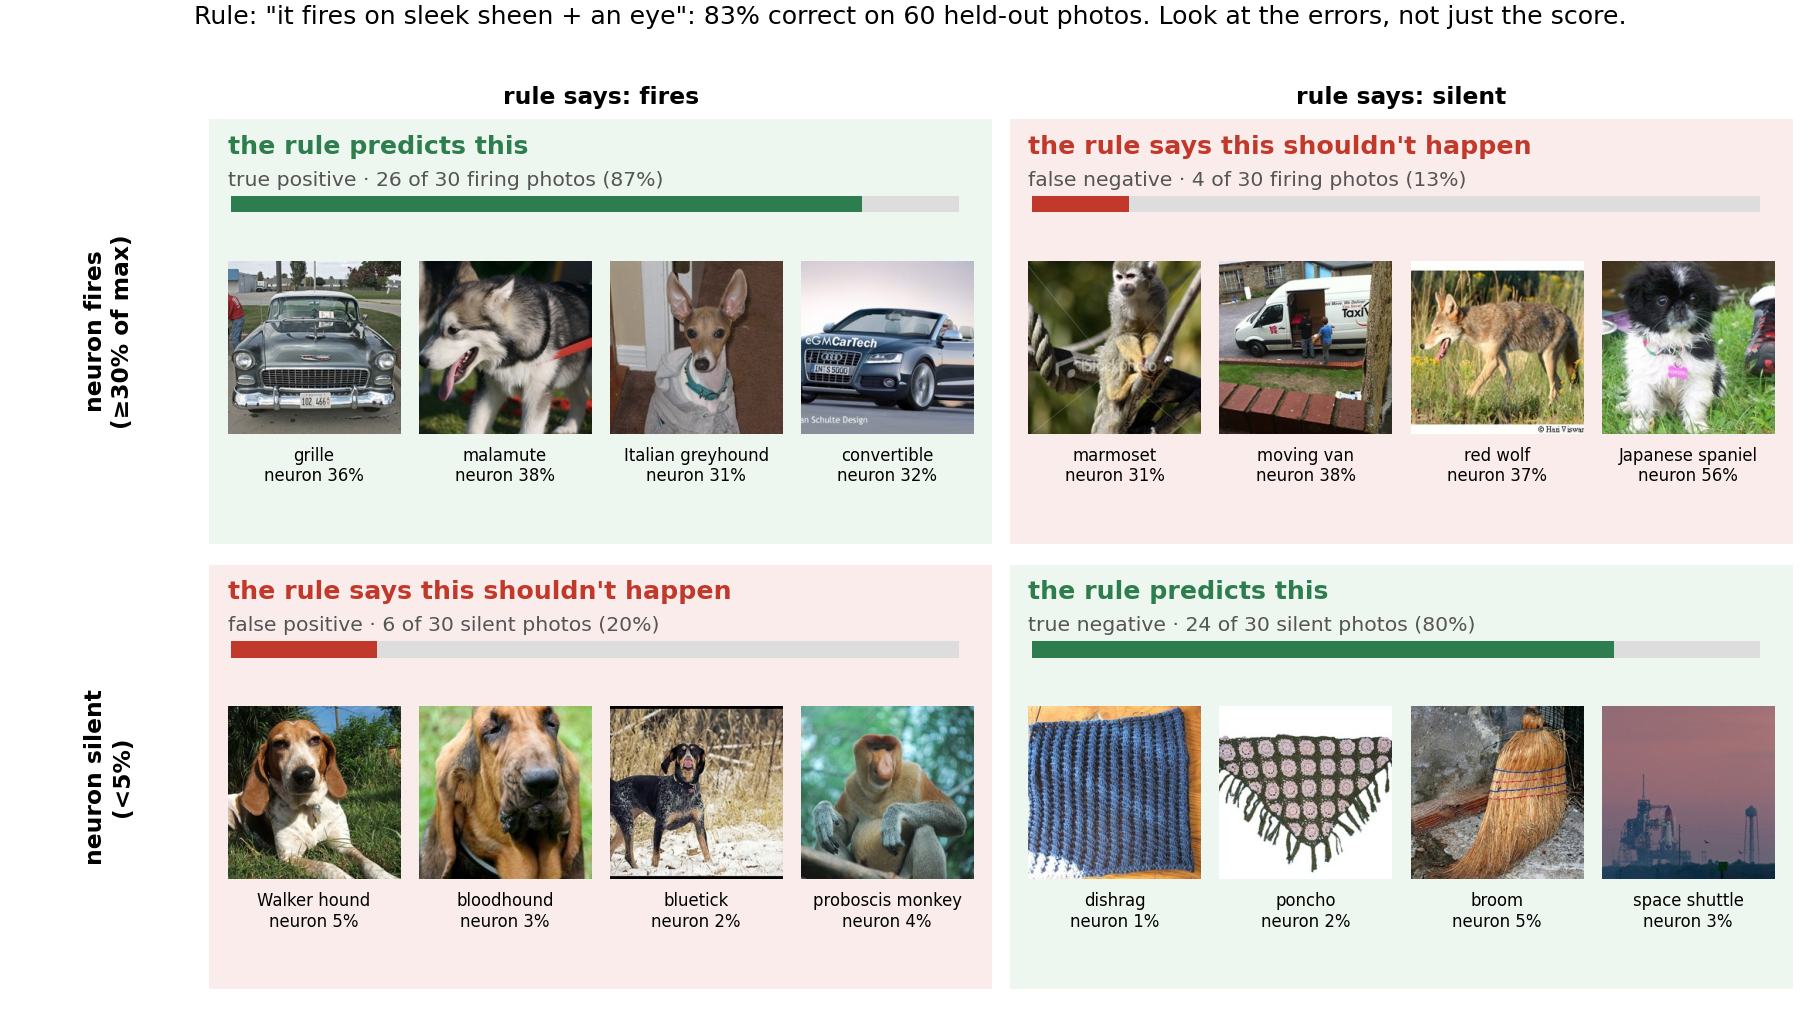
An earlier search over about 70 descriptions (gaze, mood, cuteness, texture, lighting, kiki/bouba and more) found two that predicted as well as nouns on 60 held-out photos: “sleek sheen + an eye” got 83% where the noun description got 85%. On a crop centred where the neuron responds, it got 97% (nouns 93%), but the crop does part of the work. On a harder set (photos whose class label predicts wrongly) it dropped to 57%.
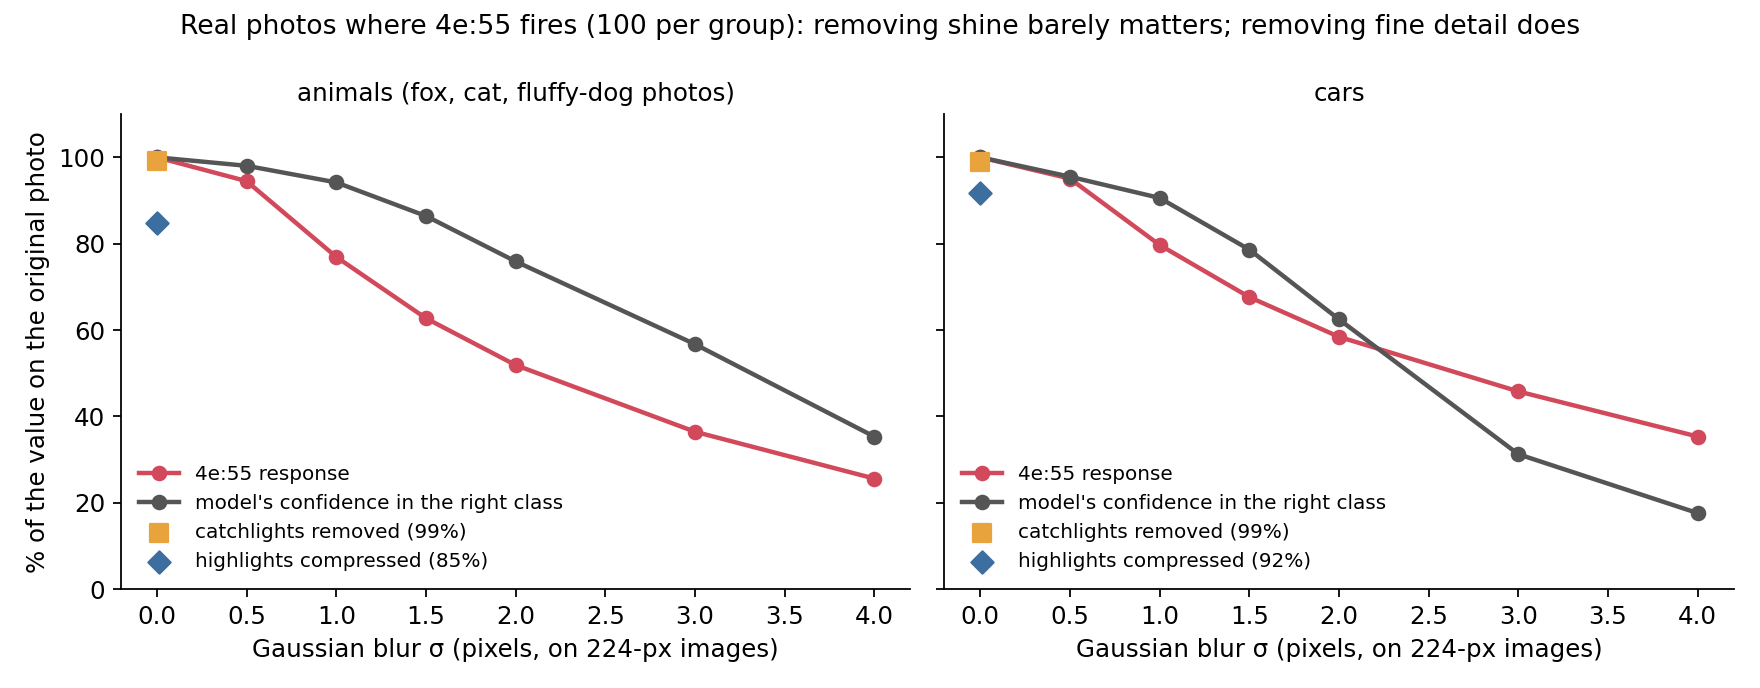
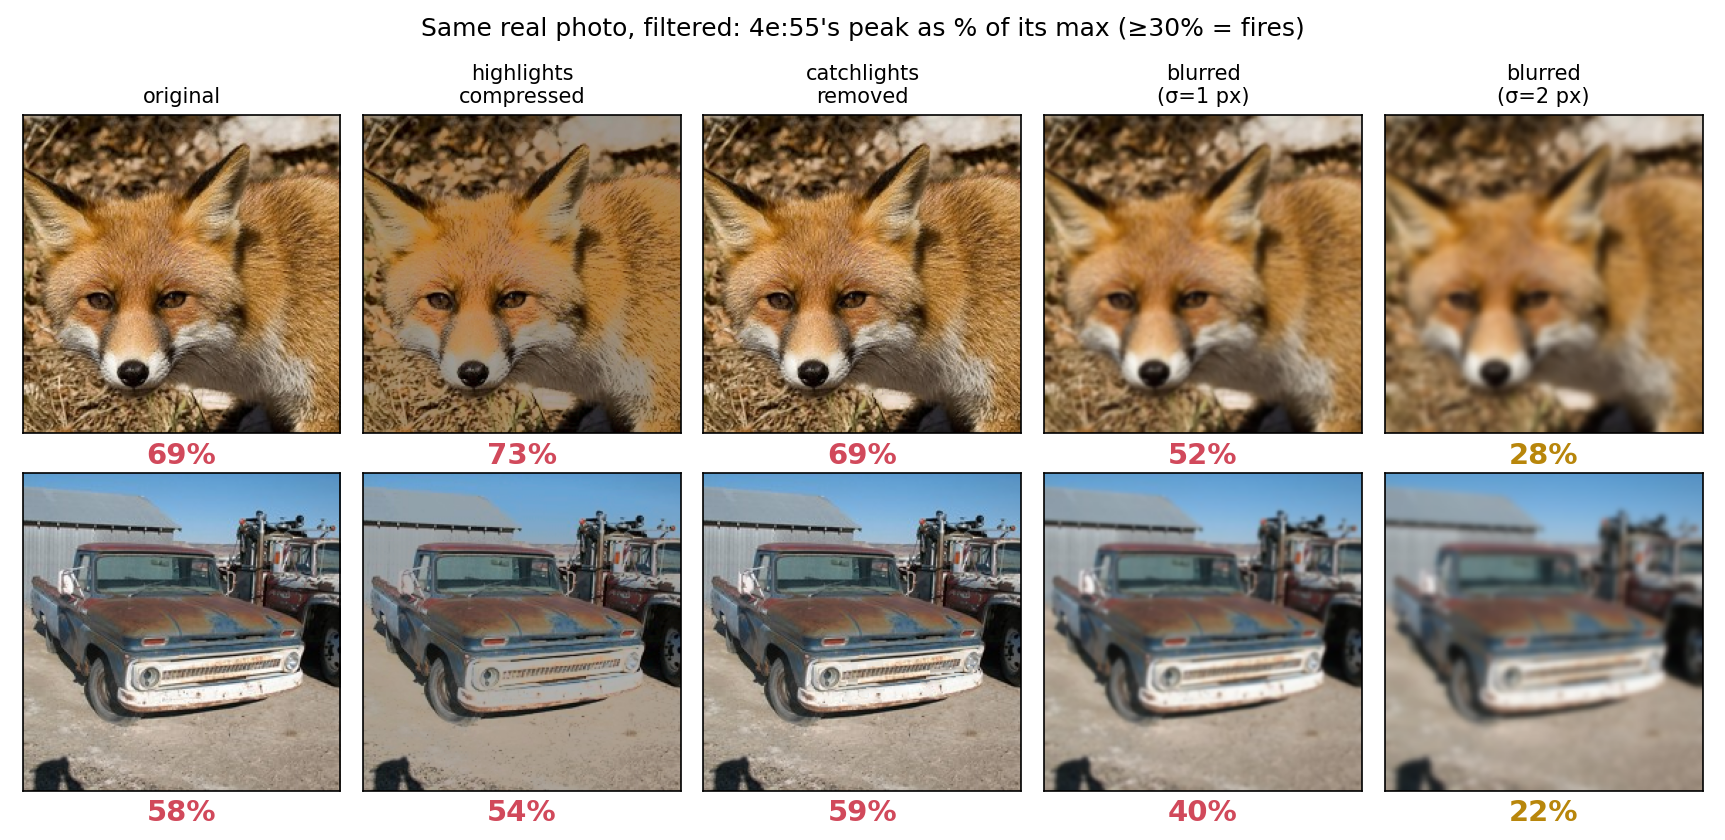
Filtering real firing photos showed it was a correlate, not the cause. Compressing highlights kept 85% of the response for animals and 92% for cars; erasing the catchlights in eyes kept 99%. Slight blur (σ = 1 px) cut the neuron by 23% for animals while the model's confidence in the right class fell 6%.
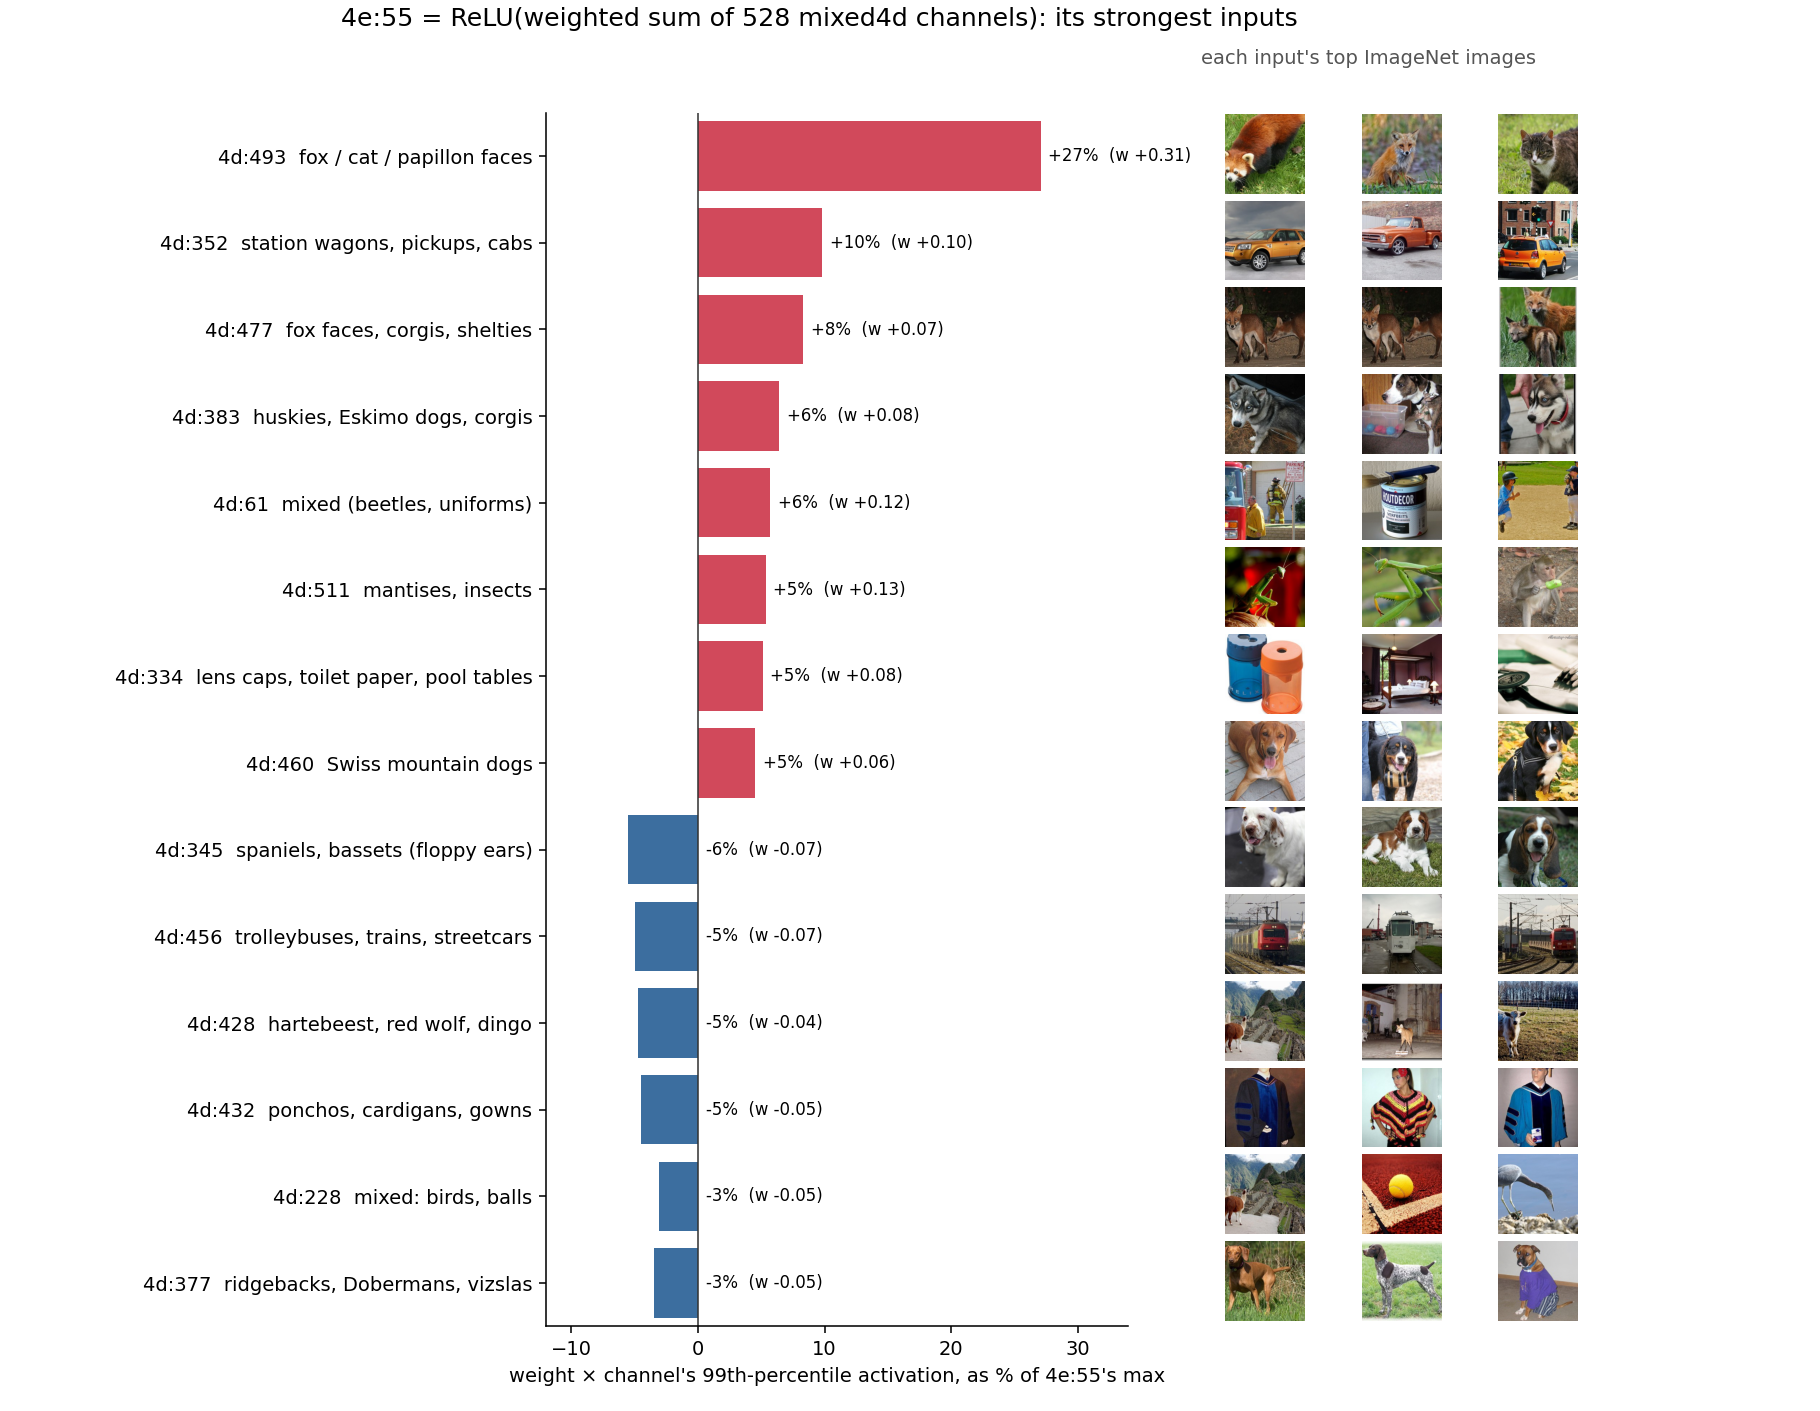
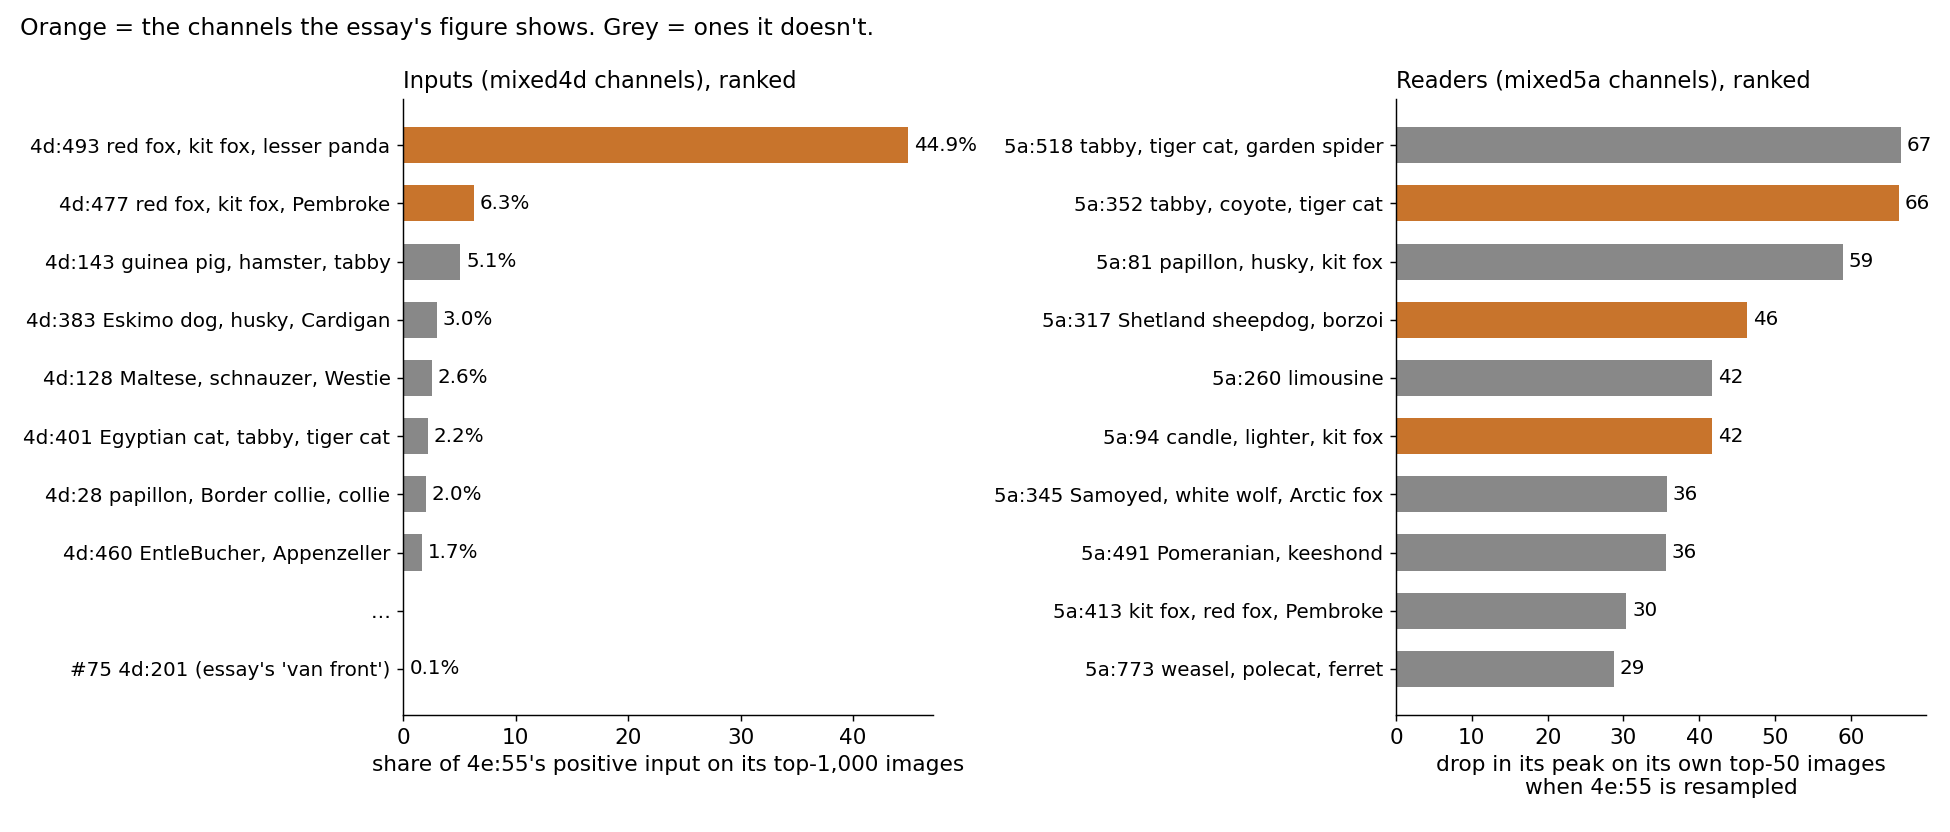
7.4 The wiring
4e:55 = ReLU(bias + weighted sum of the 528 channels of mixed4d), through mixed4e's 1×1 branch (mixed4e has 832 channels: 1×1
branch 0–255, 3×3 256–575, 5×5 576–703, pool 704–831).
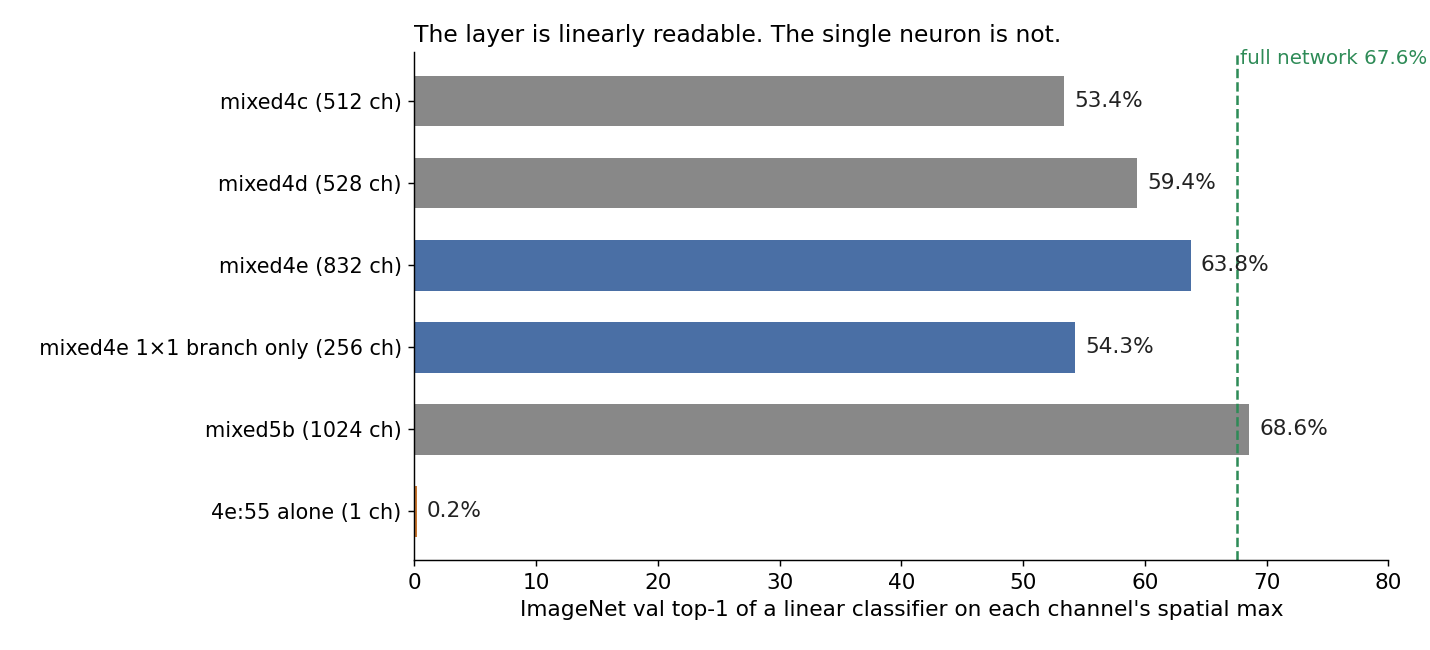
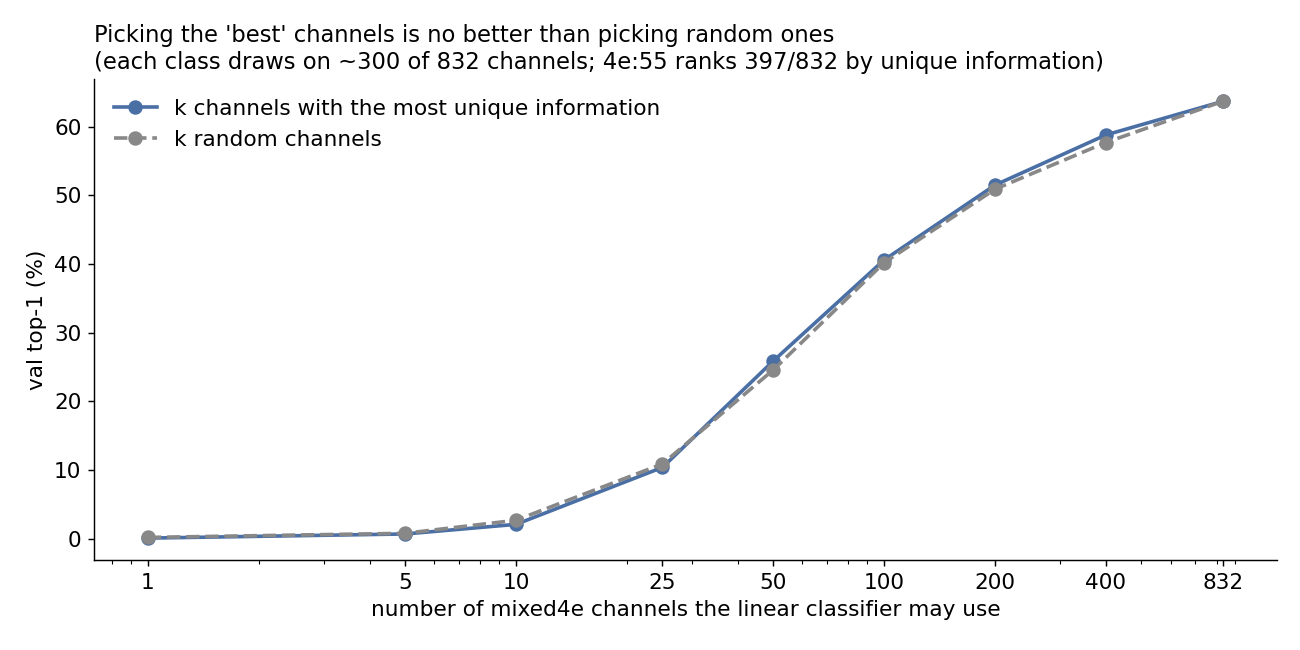
7.5 How spread out the layer's information is
7.6 Knocking it out
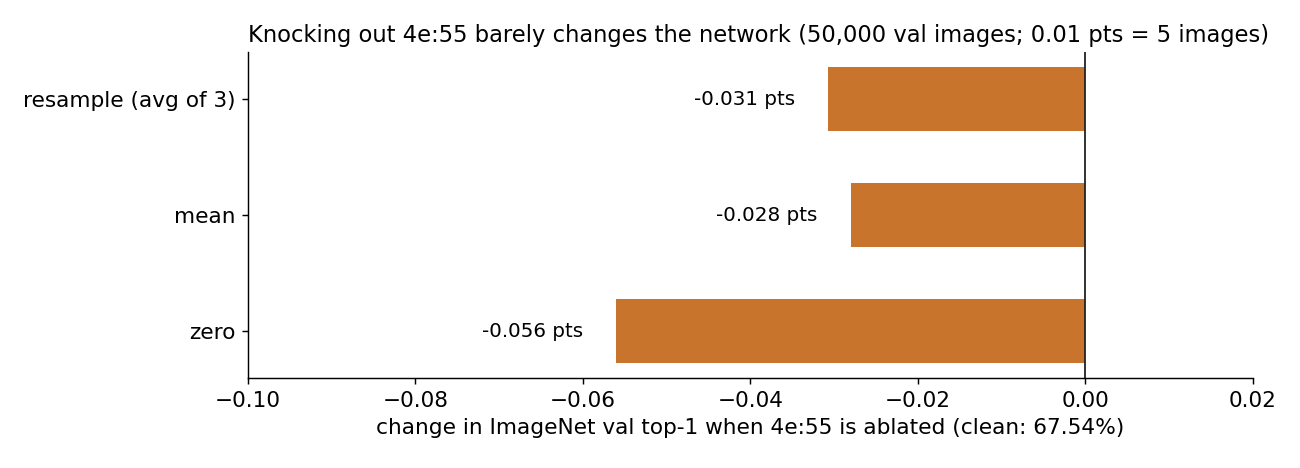
7.7 The game
The game uses 31,879 photos chosen to cover every percentile band of the neuron's response, which over-represents the rare strong photos. Each round flips a fair coin for ON or OFF, then draws a photo from that side with weight = (how common its 0.5-percentile band is in ImageNet) / (how common it is in the pool), so draws match ImageNet's real distribution within each side, like the Claude test sets. Default cutoffs: ON ≥ the 96.9th percentile and OFF ≤ the 16.1st, which select the same photos as ≥30% and <5% of the max (apart from 9 photos at the boundary). Percentiles are over all 1.28M training photos. The heatmap is the 14×14 response map, brighter where the neuron responds.
8. Caveats
- The judge is Claude (one model), not people.
- Only the extremes are tested (top 3% vs bottom 16%), which is far easier than predicting graded responses on ordinary photos.
- The 30% cutoff follows the essay's definition of a strong response; the 5% cutoff is ours.
- Test photos are new, but most firing val photos come from classes also seen during tuning.
- Result 1 and 2 numbers use 200 photos each (about ±6–7 points). The essay comparison uses 1,000.
- One neuron, one network.
9. Data and reproduction
Photo ids. A gid below 50,000 is row gid of the validation split of ILSVRC/imagenet-1k, reading its parquet shards in
filename order. Otherwise it is row gid − 50,000 of the training split, read the same way.
| File | Contents |
|---|---|
| photo_sets.json | tune, select, val and val2: gid, fires or not, value as a fraction of the max, ImageNet class |
| description_runs.json | every description scored (70 runs): text, set, accuracy, AUC, confusion counts, Claude's probability for each photo |
| essay_context_val200.json | the five essay-context prompts on the 200 val photos: probability per photo |
| reasoning_val200.jsonl, reasoning_val2_1000.jsonl | the head-to-head (prompts A, B and the lorem-ipsum control C): Claude's full reply and probability per photo |
| class_lookup_*.json | class-lookup baselines under each cutoff |
| ../data.json, ../maps.bin | the game's ~32k photos: value, class, percentile, sampling weight; 14×14 heatmaps (uint8, 196 bytes per photo) |
10. Future work and open questions
Fuzzy hypotheses, made shareable. Most real understanding sits somewhere between “full mechanistic understanding” and “unscientific vibes”. Fuzzy hypotheses are important, but they're hard to share: when I write down “it's a V-shape neuron”, the words don't carry the tacit stuff I actually mean. Is a car front pointed? The essay's figure says yes; Claude, reading the essay's sentence, mostly says no. An LLM can make a fuzzy hypothesis exact: instead of “my hypothesis is these words”, it becomes “my hypothesis is what Claude predicts given this prompt”. Anyone can rerun that.
Frozen minds solve blinding. You can give your fuzzy human hypothesis to Claude, have it form predictions before seeing the data, then see how well those predictions pan out. Any fuzzy hypothesis can be made exact this way, even big ones like the persona selection model: “given this prompt, Claude will make predictions based on the hypothesis”. We have an effectively unlimited supply of capable, blinded scientists who can be given whatever information we choose, selectively. Science should be able to get far more rigorous with that.
But rigor with fuzzy hypotheses is hard. A hypothesis is only known by what it predicts. Two hypotheses that predict the same things can't be told apart by any evidence, however different they sound. “V-shape” and “cats and cars” agree on the essay's own photos; evidence can only separate them where they disagree, like round fluffy faces. Evidence is also always relative. I can say the noun list beats pointed vs round on these photos (90% vs 56%). I can't say the noun list is the explanation, because that would need every possible hypothesis enumerated, which you basically never can.
Proofs of understanding beyond simulation. Predicting held-out activations is one proof of understanding, and the essay has fair criticisms of simulation scores (“On Simulation Scores”). What else could count?
- Predicting out of distribution: activations on edited or synthetic images the hypothesis was never tuned on.
- Predicting interventions: what happens downstream when the neuron is ablated or steered.
- Predicting before and after: does someone's new understanding let them predict better than their old one? For the essay, that would mean before and after the V-shape insight.
- Designing inputs: using the hypothesis to build images that should fire or stay silent, then checking.
Things I'd like to try:
- Letting the essay's author write the prompt, or predict the photos directly in the game.
- A standard format for publishing a “hypothesis as a prompt” alongside an interpretability claim, so readers can rerun it.